So you've shipped a Node service that talks to Postgres. It hums along at 50 req/s in staging. Then marketing sends a push notification, traffic jumps to 800 req/s for ninety seconds, and your service falls over. Not slowly. All at once. Every request hangs for fifteen seconds, then errors out with Error: timeout exceeded when trying to connect. Your app instance count tripled, autoscaling did its job, and somehow that made everything worse. The database itself looks fine. CPU at 40%. No slow queries in pg_stat_activity. Just a wall of idle in transaction you don't remember opening.
This is what a misconfigured connection pool looks like in production. It always shows up as a capacity problem ("we need more pods") when it's actually a math problem ("more pods make this worse"). And the fix is rarely about adding hardware. It's about understanding what the pool is doing, what each knob actually controls, and where in your code you're quietly leaking connections you can't see.
This piece walks through the pool from the bottom up, what it is, why it exists, the four knobs that matter, the leaks you'll write at 2am and find at 3pm, how to size the pool with arithmetic instead of vibes, and what happens when an autoscaler and a connection pool meet for the first time.
What A Pool Actually Is
A TCP connection to Postgres is not free. The TCP handshake costs a round trip. TLS adds two more. Then Postgres forks a backend process for you (yes, forks, that's still how it works in 2026 outside of dedicated pgbouncer setups), authenticates, sets session defaults, and finally lets you run a query. End-to-end, opening a fresh connection to a Postgres in the same region takes somewhere between 10ms and 100ms depending on TLS, network, and how hot the OS file cache is. Doing that on every HTTP request would dominate your latency budget.
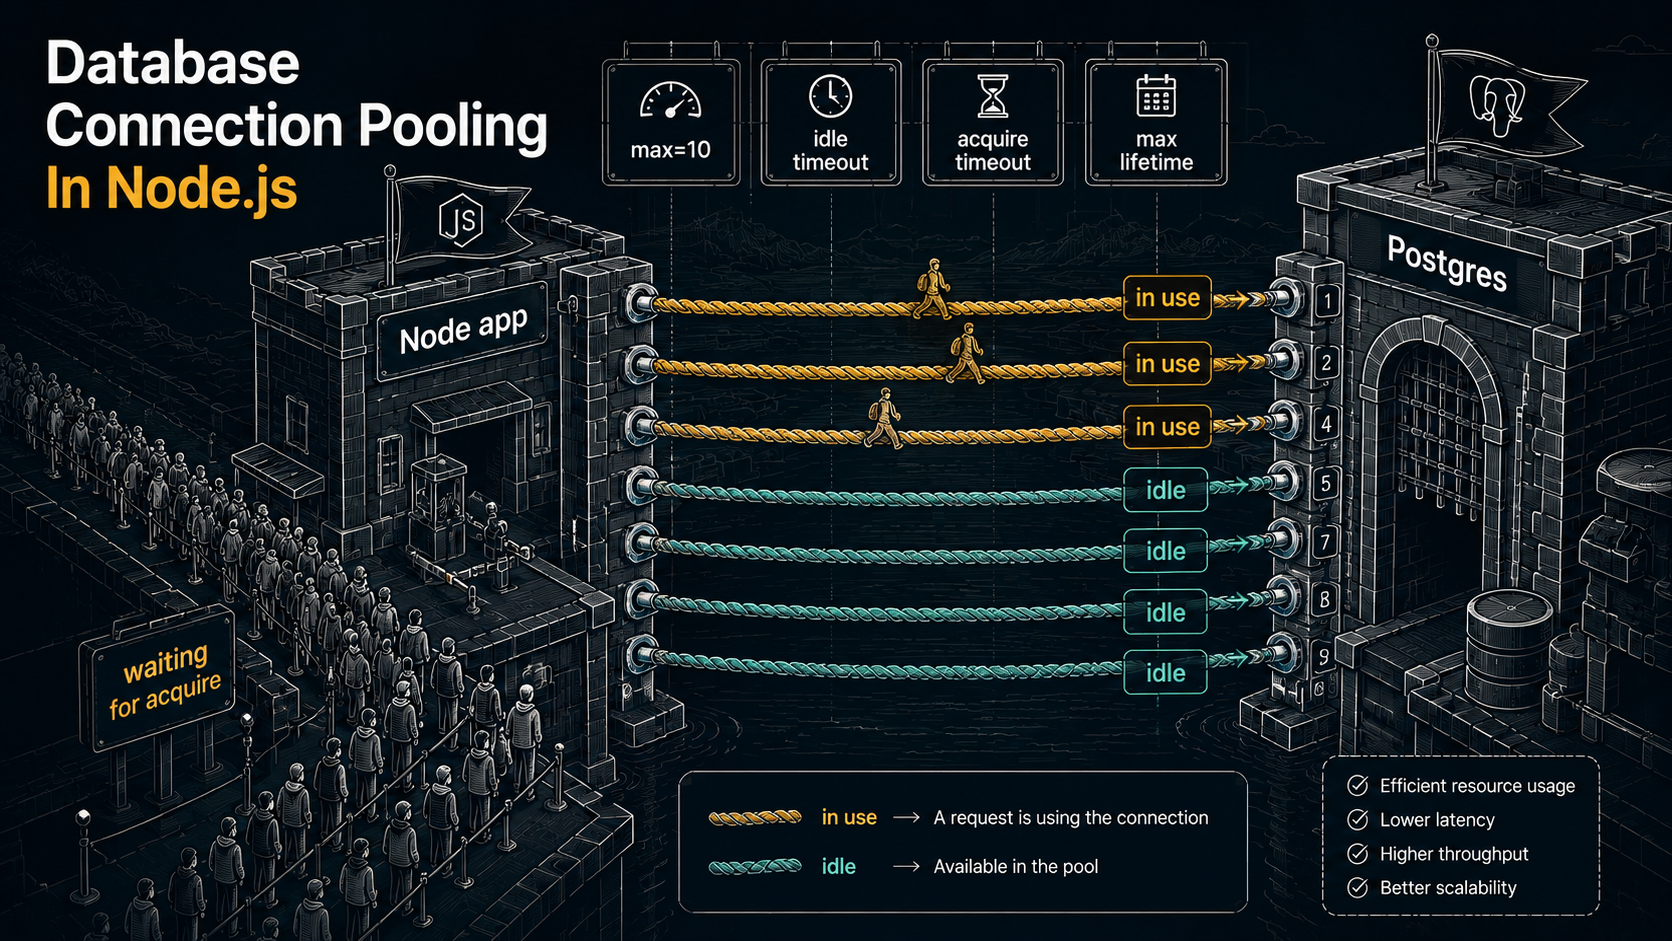
A connection pool is the trivially obvious answer: open a handful of connections at startup (or lazily on first use), keep them around, and hand them out to whoever needs one. When the caller is done, the connection goes back to the pool instead of being closed. If everything in the pool is in use, the next caller has to wait, or get rejected, depending on configuration.
That's the whole concept. The interesting bits are entirely in the policies: how many to keep, how long to wait, what to do when nothing is available, when to throw away a connection that's been around too long, how to notice that one has gone stale because a network blip killed it without anyone telling you.
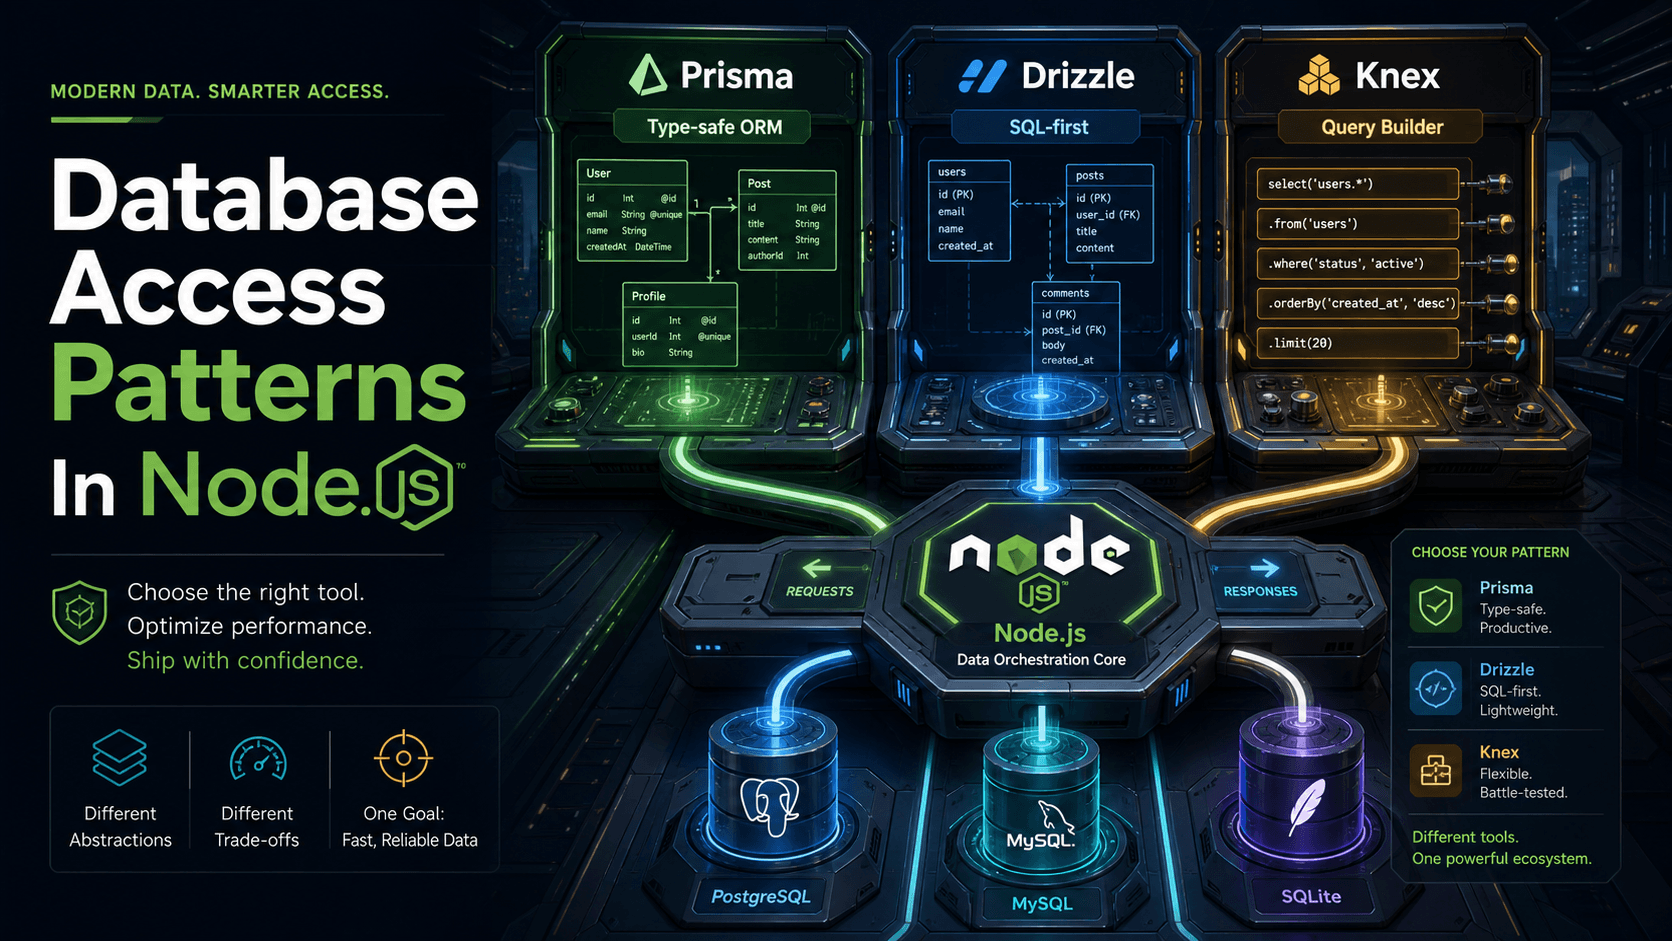
In Node, the two libraries you'll see in almost every codebase are pg (which exposes pg.Pool) for Postgres and mysql2/promise (which exposes mysql.createPool()) for MySQL. The ORMs, Prisma, TypeORM, Drizzle, Sequelize, all sit on top of one of these. Their pool knobs are mostly pass-throughs with different names. Once you understand the underlying pool, you understand all of them.
Here's the bare minimum with pg:
import { Pool } from 'pg';

export const pool = new Pool({
  connectionString: process.env.DATABASE_URL,
  max: 10,
  idleTimeoutMillis: 30_000,
  connectionTimeoutMillis: 2_000,
});

// Most of the time you just want this:
export const query = (text: string, params?: unknown[]) => pool.query(text, params);
And then in a request handler:
app.get('/users/:id', async (req, res) => {
  const { rows } = await query('select id, email from users where id = $1', [req.params.id]);
  res.json(rows[0] ?? null);
});
pool.query() grabs a connection, runs the query, returns it. You don't think about the pool. That's the point. The pool's job is to be invisible until it isn't.
The Four Knobs You'll Actually Touch
Most pool libraries have a dozen options. You'll set four of them often, two more occasionally, and the rest will live on their defaults forever. Let's talk about the four.
max is the size of the pool. The maximum number of physical TCP connections this single Node process will hold open to the database. If max is 10 and 11 requests need a connection at the same time, the 11th waits. Default in pg is 10. Default in mysql2 (connectionLimit) is 10. We'll spend most of the "sizing" section below on this number, because it's the one you'll get wrong first.
connectionTimeoutMillis (called acquireTimeout in some libraries) is how long a request will wait for a free connection before giving up. If the pool is full and every connection is busy, this is the timer that decides when the caller sees an error vs. when it gets a connection. Default in pg is zero, which means "wait forever", almost never what you want in a web service. Set this to something between 1 and 5 seconds. The right number is "less than your upstream timeout, with room to spare."
idleTimeoutMillis is how long a connection can sit in the pool unused before the pool closes it. The point of this is to shrink the pool back down after a traffic spike, so you're not holding 50 idle backends on the database during the quiet hours. Default in pg is 10 seconds, which is fine for most services. Set it shorter only if you have very bursty traffic and care about freeing database memory between bursts.
maxLifetimeSeconds (newer pg versions) and maxUses are about forced rotation. Every connection gets retired after this much time (or this many queries), so the pool can re-open it. This sounds like fussy housekeeping until you realise that long-lived connections accumulate junk: orphaned temp tables, weird session settings somebody set and forgot to reset, the occasional memory bloat in the Postgres backend process. Rotating connections every hour or so means none of that ever gets bad enough to notice. Default for both is "unlimited", set maxLifetimeSeconds: 3600 and forget about it.
A reasonable starting point for a small web service:
export const pool = new Pool({
  connectionString: process.env.DATABASE_URL,
  max: 10,
  idleTimeoutMillis: 30_000,
  connectionTimeoutMillis: 2_000,
  maxLifetimeSeconds: 3600,
});
That's it. Five lines, four numbers. We'll talk about why max: 10 is the most dangerous of the five.
How Pool Sizing Actually Works
The number max: 10 is innocent-looking. Let's see what it means in production.
You have one pod. max: 10. Postgres max_connections is 100 (the default). You're using 10 of 100. Plenty of room.
Marketing pushes a notification. Your autoscaler reads the latency spike and goes from 1 pod to 8 pods. Each pod has max: 10. You're now using 80 of 100. Still room.
A second team's service shares the database. They run 5 pods with max: 10 each. 80 + 50 = 130. Postgres rejects connection attempts. Your pods can't open new connections. Requests timeout on acquire. The autoscaler sees the latency and scales to 12 pods. Each new pod tries to open 10 connections at startup. They all fail. The pod restarts. You're now in a loop where the only way the system stabilises is if traffic drops on its own.
This is the most common cascade in cloud Postgres, and it's entirely caused by max * pods exceeding the database limit.
The rule that fixes it is uncomfortably simple:
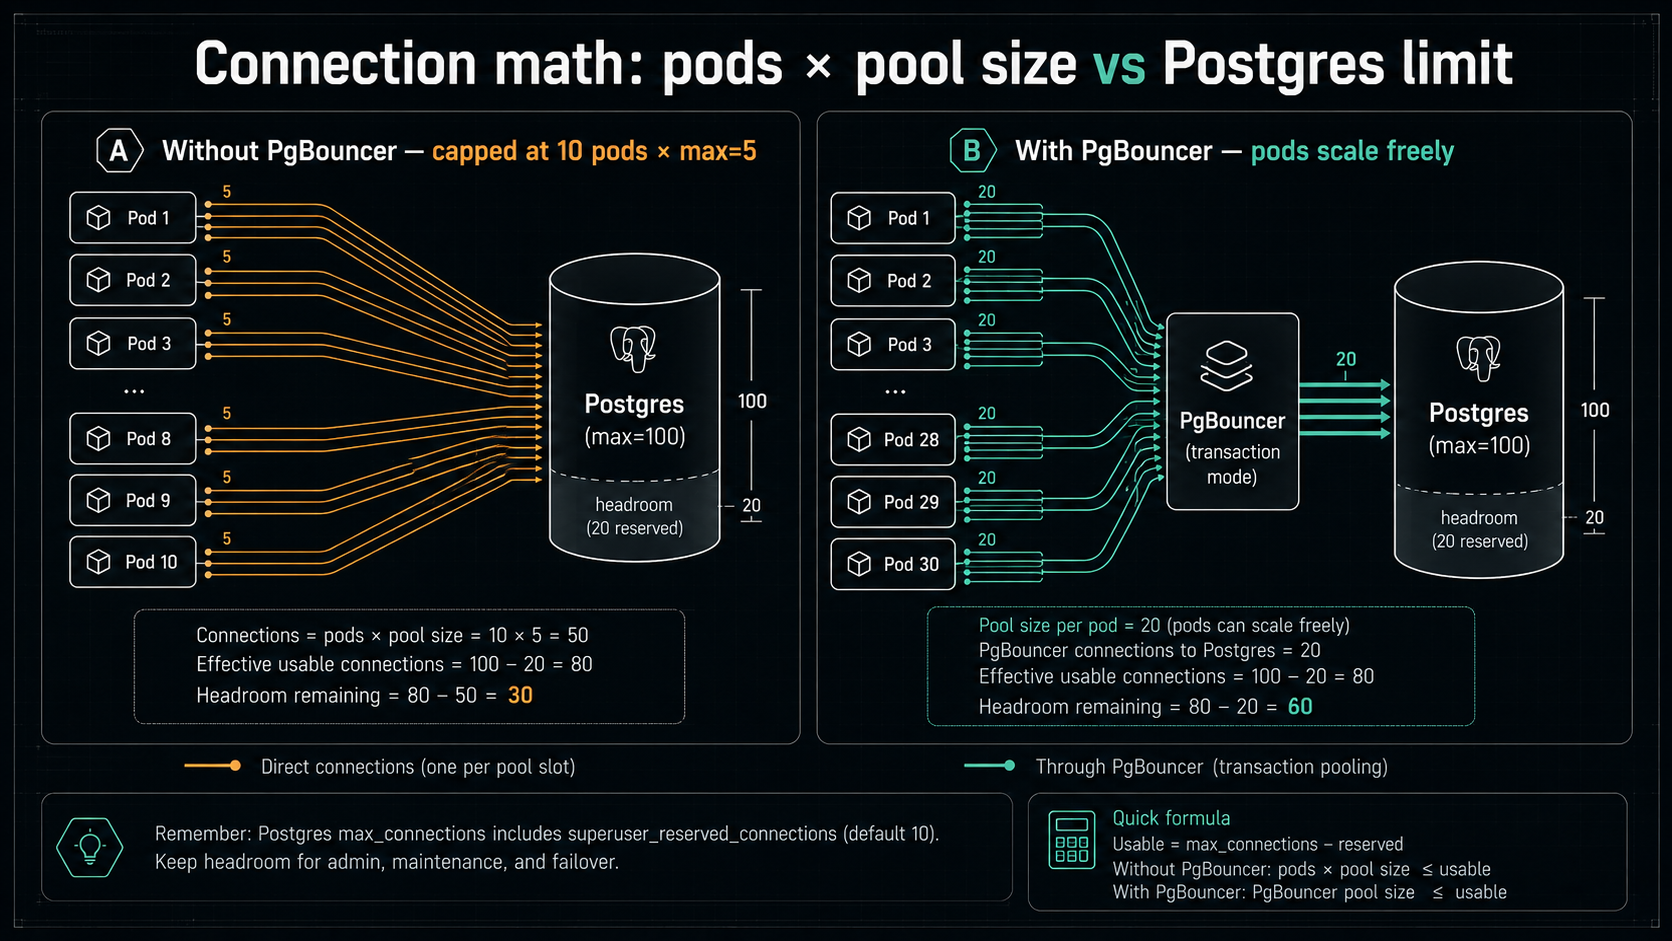
max_pool_size_per_pod * max_pod_count + other_services_total <= database_max_connections * 0.8The * 0.8 is because Postgres reserves some connections for replication, superuser sessions, and your psql window when you're trying to debug at 2am.
Plug in your numbers. If Postgres allows 100 connections and you share with one other service (assume they use 30 total), you have 50 left for your service. If your autoscaler can go up to 10 pods, that's 50 / 10 = 5. So max: 5 per pod. If you want max: 10, your autoscaler can only go up to 5 pods. You don't get to ignore this trade-off, the database will pick it for you, badly.
The instinct most teams have is to raise Postgres's max_connections. Sometimes you can. Often you can't (managed services have hard limits, or your instance class caps out below what you'd want). And even when you can, you usually shouldn't. Postgres backend processes each eat memory, the rough rule is work_mem * max_connections for the worst case, and adding zeros to max_connections can quietly push you to swap. The real answer for "we need more connections" is almost always PgBouncer in transaction-pooling mode, sitting between your pods and the database. PgBouncer multiplexes thousands of client-side connections onto a much smaller pool of real Postgres backends. Your Node pools talk to PgBouncer; PgBouncer talks to Postgres; the math problem disappears.
The trade-off is that PgBouncer in transaction mode means you can't use session-level features: no SET LOCAL outside a transaction, no advisory locks held across queries, no LISTEN/NOTIFY, no prepared statements (in classic PgBouncer; newer versions like PgBouncer 1.21+ have transaction-safe prepared-statement support but it's worth checking before you turn it on). If your code relies on any of that, you'll need session mode (which gives you back the max * pods problem at a different layer) or you'll need to refactor.
The actual answer is: you size the pool based on real concurrency, not on hopes. If your service handles 200 req/s and the average query is 5ms, your steady-state concurrency is 200 * 0.005 = 1 connection. You don't need 10. You need 1, with maybe 2 or 3 for headroom. Most services overshoot the pool size by a factor of 5 because the default sounds reasonable. Measure first.
Where Leaks Actually Live
A pool leak is when you grab a connection and never give it back. The pool keeps shrinking because each leak is one fewer connection available, until the pool is empty and every request waits forever.
The pool.query() shape we used above can't leak, the pool grabs and releases the connection for you in one call. But there's a second shape, pool.connect(), that gives you the connection directly so you can run multiple queries in a transaction, and that shape leaks all the time. Watch:
// THIS LEAKS UNDER ERRORS
app.post('/transfer', async (req, res) => {
  const client = await pool.connect();
  await client.query('BEGIN');
  await client.query('UPDATE accounts SET balance = balance - $1 WHERE id = $2', [amount, fromId]);
  await client.query('UPDATE accounts SET balance = balance + $1 WHERE id = $2', [amount, toId]);
  await client.query('COMMIT');
  client.release();
  res.json({ ok: true });
});
If the second UPDATE throws, bad input, constraint violation, network hiccup, control flies out of the function before client.release() runs. The connection is checked out forever. You'll never see it again. Do this on enough request paths and the pool empties out over hours or days, and one Tuesday the service falls over for no reason your logs can explain.
The fix is the standard try/finally:
app.post('/transfer', async (req, res) => {
  const client = await pool.connect();
  try {
    await client.query('BEGIN');
    await client.query('UPDATE accounts SET balance = balance - $1 WHERE id = $2', [amount, fromId]);
    await client.query('UPDATE accounts SET balance = balance + $1 WHERE id = $2', [amount, toId]);
    await client.query('COMMIT');
    res.json({ ok: true });
  } catch (err) {
    await client.query('ROLLBACK').catch(() => {});
    throw err;
  } finally {
    client.release();
  }
});
release() goes in finally. ROLLBACK goes in catch. The .catch(() => {}) on the rollback is because if the connection is itself broken, you don't want the rollback error to mask the real error. The original throw err still propagates.
A helper makes this less painful to write a hundred times:
export async function withTransaction<T>(fn: (client: PoolClient) => Promise<T>): Promise<T> {
  const client = await pool.connect();
  try {
    await client.query('BEGIN');
    const result = await fn(client);
    await client.query('COMMIT');
    return result;
  } catch (err) {
    await client.query('ROLLBACK').catch(() => {});
    throw err;
  } finally {
    client.release();
  }
}
And the leaky handler becomes:
app.post('/transfer', async (req, res) => {
  await withTransaction(async (client) => {
    await client.query('UPDATE accounts SET balance = balance - $1 WHERE id = $2', [amount, fromId]);
    await client.query('UPDATE accounts SET balance = balance + $1 WHERE id = $2', [amount, toId]);
  });
  res.json({ ok: true });
});
You can't write the leak anymore because the helper owns the lifecycle. Every codebase that talks to a pool should have something shaped like this and nobody should be writing pool.connect() outside of it.
The second leak is subtler. It's when a connection is technically released but the database thinks it's still busy because you left a transaction open. This shows up in pg_stat_activity as a row with state = 'idle in transaction'. The connection is back in your Node pool, ready to be handed out, but Postgres is still holding locks for the transaction the previous user opened and forgot to close. The next caller gets the connection, runs a query inside the orphaned transaction without knowing, and you have one of those bugs where data is sometimes wrong for no apparent reason.
The fix here is to make sure every BEGIN has a paired COMMIT or ROLLBACK on the same connection, before the connection is released. The withTransaction helper handles this. Don't grab a connection, start a transaction, and rely on some downstream code to finish it, that's how orphaned transactions are born.
The Timeouts You Need To Understand
You have at least four timeouts in play when a Node request hits Postgres. Most outages come from these being set in the wrong order.
The acquire timeout (connectionTimeoutMillis in pg) is how long the request waits inside Node for a pool connection. If this fires, you get an error before any query runs.
The query timeout is how long an individual statement is allowed to run. In pg, you set this on the client with statement_timeout (which the pool will apply to each new connection), or you pass query_timeout to the Pool config (which is enforced from the Node side). In Postgres, you can also SET statement_timeout = '5s' per session or per transaction. If this fires, the statement is cancelled and the query rejects with an error, but the connection is fine and goes back to the pool.
The transaction timeout (idle_in_transaction_session_timeout in Postgres) is how long Postgres will let a session sit in idle in transaction before forcibly closing the connection. This is the backstop for the orphan-transaction leak. Set it to something like 60 seconds on the database side, it's a server-level safety net that costs you nothing.
The upstream timeout is whatever timeout your HTTP client or load balancer applies. If your ALB times out requests at 30 seconds and your acquire+query timeouts can sum to 60, then the client always sees a 504 and your service spends 30 more seconds processing a query nobody is waiting for. Acquire timeout + query timeout + a small buffer should always be less than the upstream timeout.
Put together, a sensible setup for an HTTP service with a 30s ALB timeout looks like:
const pool = new Pool({
  connectionString: process.env.DATABASE_URL,
  max: 10,
  connectionTimeoutMillis: 3_000,     // wait up to 3s for a pool slot
  idleTimeoutMillis: 30_000,
  maxLifetimeSeconds: 3600,
  // statement_timeout is most reliably set via DATABASE_URL options or per-query:
  // postgres://...?options=-c statement_timeout=20000
});
And on the database, in a migration or admin task:
ALTER ROLE app_user SET statement_timeout = '20s';
ALTER ROLE app_user SET idle_in_transaction_session_timeout = '60s';
Now: 3s acquire + 20s query = 23s, well below the 30s upstream. If something hangs longer than that, both Postgres and Node have an answer that doesn't require a deploy.
The Death Spiral
Here's the failure mode that's worth its own section because it's how most pool incidents turn from "slow" into "down".
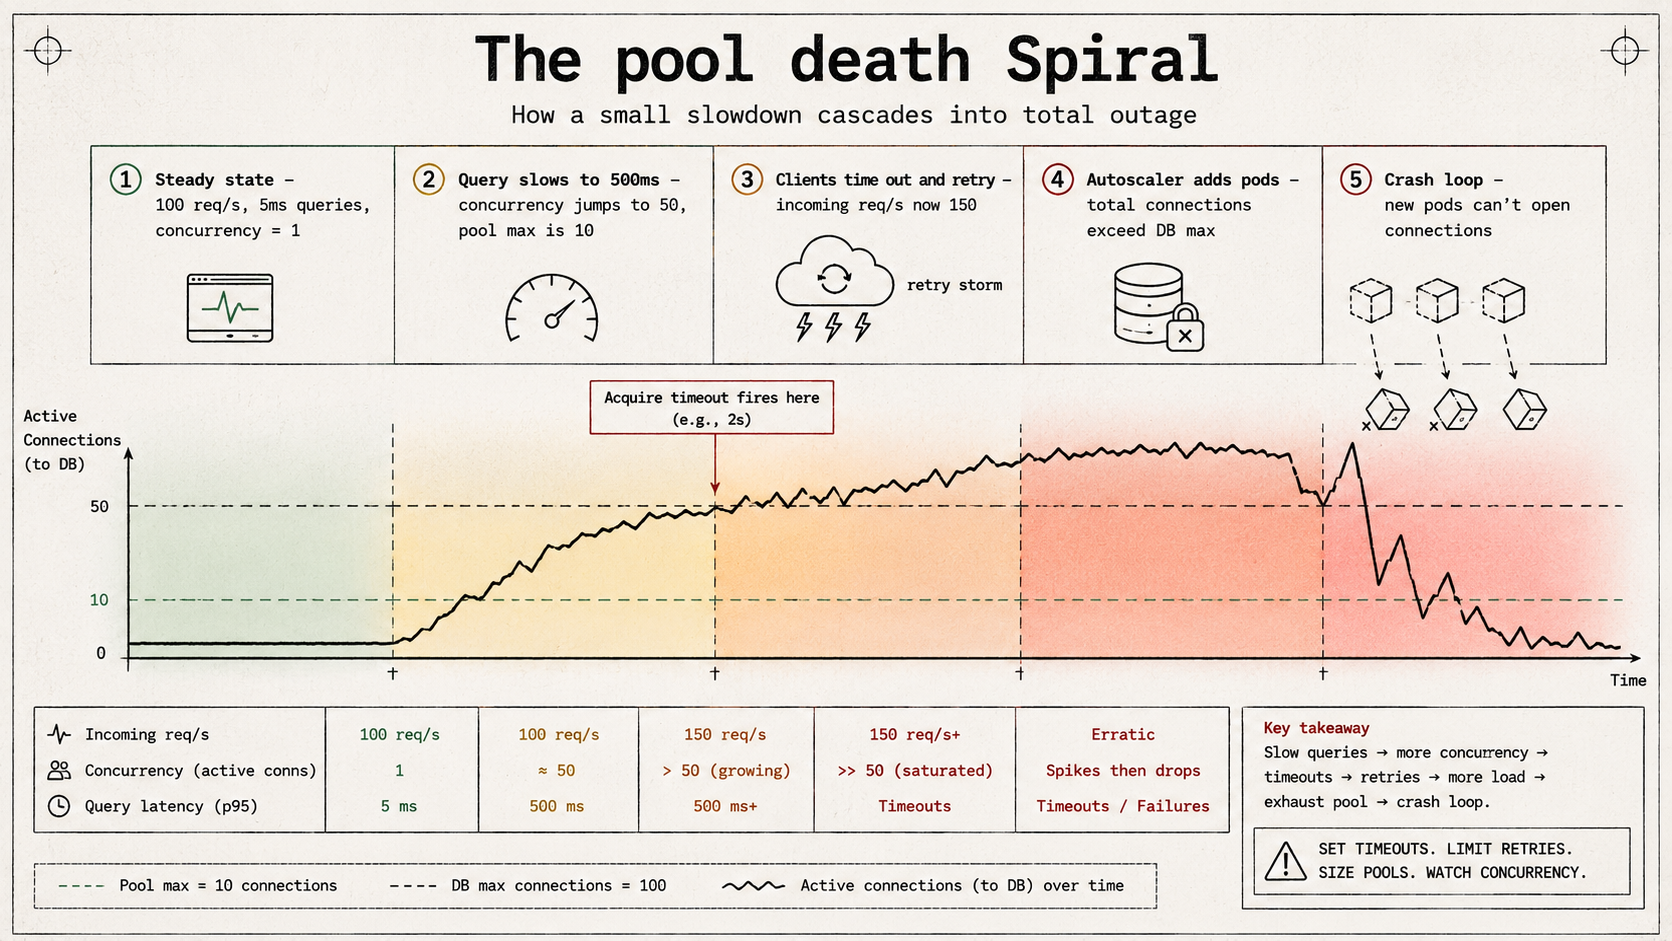
Imagine you run with max: 10 and your service normally serves 100 req/s with a 5ms average query. Concurrency is around 1. You're nowhere near the pool limit.
Now something gets slow. A migration just rewrote a table and the planner picked a bad plan. Queries that used to take 5ms now take 500ms. Your concurrency is suddenly 100 * 0.5 = 50. The pool can hold 10. The other 40 requests per second are waiting.
If your acquire timeout is 5 seconds, those requests sit in the queue for 5 seconds. Your client probably has a 3s timeout, gets bored, retries. Now you have 150 req/s of attempted work on a 10-connection pool. The queue grows. P99 goes from 5ms to 8 seconds. The autoscaler reads the P99 and adds pods. Each new pod opens 10 more connections. You're now at 200 connections against a database that allows 100. Half the pods can't open connections at all and crash-loop.
Nothing about this story involves a "real" failure. Everything that's happening is each layer doing exactly what it's supposed to do. The query got slow. The clients retried. The autoscaler scaled. The pool waited. The database refused. Composing these correct behaviours produced an outage.
The defenses, in priority order:
Cap retries. If a single request can spawn three retries and each retry waits up to 5 seconds on the pool, one bored user effectively occupies four pool slots. Cap retry counts; add jitter; ideally use a circuit breaker upstream of the pool so retry storms can't even reach it.
Shrink the acquire timeout. A 5-second acquire timeout means a slow database wedges your Node event loop with waiting promises. Shrink it to 1 second; let the request fail fast; the queue stays small; the autoscaler sees errors instead of latency and can scale on the right signal, or, better, you alert on errors and don't scale at all.
Fix the autoscaling signal. Latency-based autoscaling assumes the bottleneck is CPU. With a pool, the bottleneck is connections, which is a hard cap, adding pods past a certain point makes things worse, not better. Scale on CPU + request queue length, not on response latency.
Use PgBouncer. If you really do need thousands of effective connections from a fleet of pods, PgBouncer in transaction mode is the answer. Don't try to hold thousands of direct Postgres backends, you'll lose.
Have a budget for "slow query day." Pick a number, "we tolerate 200ms p99 queries", and alert when it's exceeded. The pool is most fragile when query latency creeps up over a week and nobody notices. The cliff is sudden, but the slope leading to it isn't.
How To See Inside Your Pool
You can't fix what you can't see, and the default observability of a pg.Pool is exactly two log lines: nothing, and a stack trace when something dies. Let's improve that.
pg.Pool exposes three numeric counters that tell you almost everything you need:
pool.totalCount   // open physical connections (idle + in use)
pool.idleCount    // open but unused
pool.waitingCount // requests queued for a connection
A request waiting for the pool is the single most important signal in this whole system. If waitingCount > 0 for more than a moment, you're at capacity. Export this as a Prometheus gauge:
import { collectDefaultMetrics, Gauge } from 'prom-client';

collectDefaultMetrics();

const totalGauge = new Gauge({ name: 'pg_pool_total', help: 'Total pg pool connections' });
const idleGauge = new Gauge({ name: 'pg_pool_idle', help: 'Idle pg pool connections' });
const waitingGauge = new Gauge({ name: 'pg_pool_waiting', help: 'Requests waiting for a pg connection' });

export function reportPoolMetrics(pool: import('pg').Pool) {
  setInterval(() => {
    totalGauge.set(pool.totalCount);
    idleGauge.set(pool.idleCount);
    waitingGauge.set(pool.waitingCount);
  }, 1000).unref();
}
Then alert on:
pg_pool_waiting > 0sustained for more than 10 seconds, you're at pool capacity.pg_pool_total / max > 0.8sustained, you're close to capacity; size up or shed load.pg_pool_totalcollapsing toward zero with traffic still flowing, you're leaking; somebody isn't releasing.
The pool also emits events you can hook for richer logging:
pool.on('connect', (client) => console.log('pg: new connection opened'));
pool.on('acquire', (client) => { /* a checkout */ });
pool.on('remove', (client) => console.log('pg: connection closed'));
pool.on('error', (err, client) => console.error('pg: pool error', err));
Don't log on every acquire in production, that's hundreds of log lines per second for nothing. But the connect/remove/error events are low-volume and worth keeping.
On the Postgres side, three queries are worth knowing by heart:
select pid, usename, application_name, client_addr, state, query
from pg_stat_activity
where datname = current_database()
order by state, query_start;select count(*) from pg_stat_activity
where state = 'idle in transaction';select count(*) as used,
current_setting('max_connections')::int as max,
round(100.0 * count(*) / current_setting('max_connections')::int, 1) as pct
from pg_stat_activity;If you put pct on a Grafana dashboard next to your service's pg_pool_waiting, you'll diagnose 90% of pool incidents in the first 30 seconds of looking.
Special Cases Worth Knowing About
A few setups behave differently enough to be worth calling out.
Serverless functions (Lambda, Vercel Functions, Cloudflare Workers, etc.) are the worst possible environment for a direct connection pool. Each invocation might be a fresh container, so the pool starts empty, the first request opens a connection, and the second request might or might not reuse it depending on whether it landed on the same container. With enough concurrent invocations, you'll hit Postgres max_connections instantly. The right answer for serverless is either a dedicated proxy (RDS Proxy, Neon's pooler, Supabase's pooler, or self-hosted PgBouncer) or a driver designed for serverless (Neon's HTTP driver, Cloudflare Hyperdrive) that doesn't hold a long-lived TCP connection at all.
Long-running background jobs sometimes want a totally separate pool from your HTTP traffic, usually a small one (max: 2), so a stuck job can't drain the pool that serves users. Two pools, two DATABASE_URLs (or the same URL with different application_name), and you get isolation for free.
Replicas, if you've got read replicas, the pattern is one pool per replica (or a single pool against a read-side load balancer like PgPool). You generally don't want one pool that tries to "balance" between primary and replica because failover semantics get nasty.
Multi-tenant applications using SET ROLE, if you switch the active role per request to apply row-level security, you must RESET ROLE (or RESET ALL) before releasing the connection. Otherwise the next caller inherits the previous tenant's role and sees their data. This is a textbook example of why session state and pooling don't mix unless you're disciplined.
ORMs that wrap the pool, Prisma, Drizzle, TypeORM, Sequelize. Their config options are mostly pass-throughs with rebranded names. Prisma's connection_limit is pg.Pool's max. Drizzle delegates to whatever underlying driver you pass it, so you tune the driver directly. TypeORM has extra: { max: 10 } in the data source options. Sequelize has pool: { max: 10, min: 0, idle: 30000 }. The math from the sizing section still applies regardless of which library spells it.
A Sane Default For New Services
If you're standing up a new Node service today and you have no special requirements yet, this is a defensible starting point:
import { Pool } from 'pg';

export const pool = new Pool({
  connectionString: process.env.DATABASE_URL,
  max: 10,
  idleTimeoutMillis: 30_000,
  connectionTimeoutMillis: 3_000,
  maxLifetimeSeconds: 3600,
});

pool.on('error', (err) => {
  // Idle pool errors should not crash the process. Log loudly and let the
  // pool recover by removing the bad client on its own.
  console.error('pg pool error (idle client)', err);
});

export async function withTransaction<T>(
  fn: (client: import('pg').PoolClient) => Promise<T>,
): Promise<T> {
  const client = await pool.connect();
  try {
    await client.query('BEGIN');
    const result = await fn(client);
    await client.query('COMMIT');
    return result;
  } catch (err) {
    await client.query('ROLLBACK').catch(() => {});
    throw err;
  } finally {
    client.release();
  }
}

// Graceful shutdown — drain the pool before the process exits.
async function shutdown() {
  try { await pool.end(); } catch {}
  process.exit(0);
}
process.on('SIGTERM', shutdown);
process.on('SIGINT', shutdown);
Database side, in a migration:
ALTER ROLE app_user SET statement_timeout = '20s';
ALTER ROLE app_user SET idle_in_transaction_session_timeout = '60s';
That's about 30 lines of code that prevent most of the pool incidents in this article. Once you can describe, out loud, without checking, what each of those numbers means and what cascade each one defends against, you've got most of what there is to know about pooling in Node.
The pool isn't a clever piece of infrastructure. It's a list of TCP sockets and a queue. Almost every problem you'll have with it is downstream of two questions: did I hand the connection back? and did I pick numbers that match the database I'm talking to? Get those right and the pool stays invisible. Get them wrong and it'll be the only thing your post-mortem talks about.