Your backend has perfect dashboards.
Latency, error rate, throughput, traces from edge to database, structured logs with a correlation ID stitched through every hop. You can answer almost any question about what happened on the server in the last 14 days. That part of the system is observable.
Then a user emails support: "the page froze when I clicked checkout, then it logged me out." You open the dashboards. No errors. No slow requests. No 5xx. The user's session, from the server's point of view, looks fine.
That's the entire problem with frontend observability in one paragraph. The user lives in a place you don't control - their browser, their network, their device, their tab they left open for nine hours - and most of what goes wrong there never reaches your servers. If you want to debug what they saw, you need to send it home before the tab closes.
This is what frontend observability is for. Not vanity dashboards, not "page views per second" - the boring, practical job of catching errors the user hit, measuring how the page actually felt to them, tracing a click all the way to your database, and occasionally watching a replay of the session so you can stop guessing.
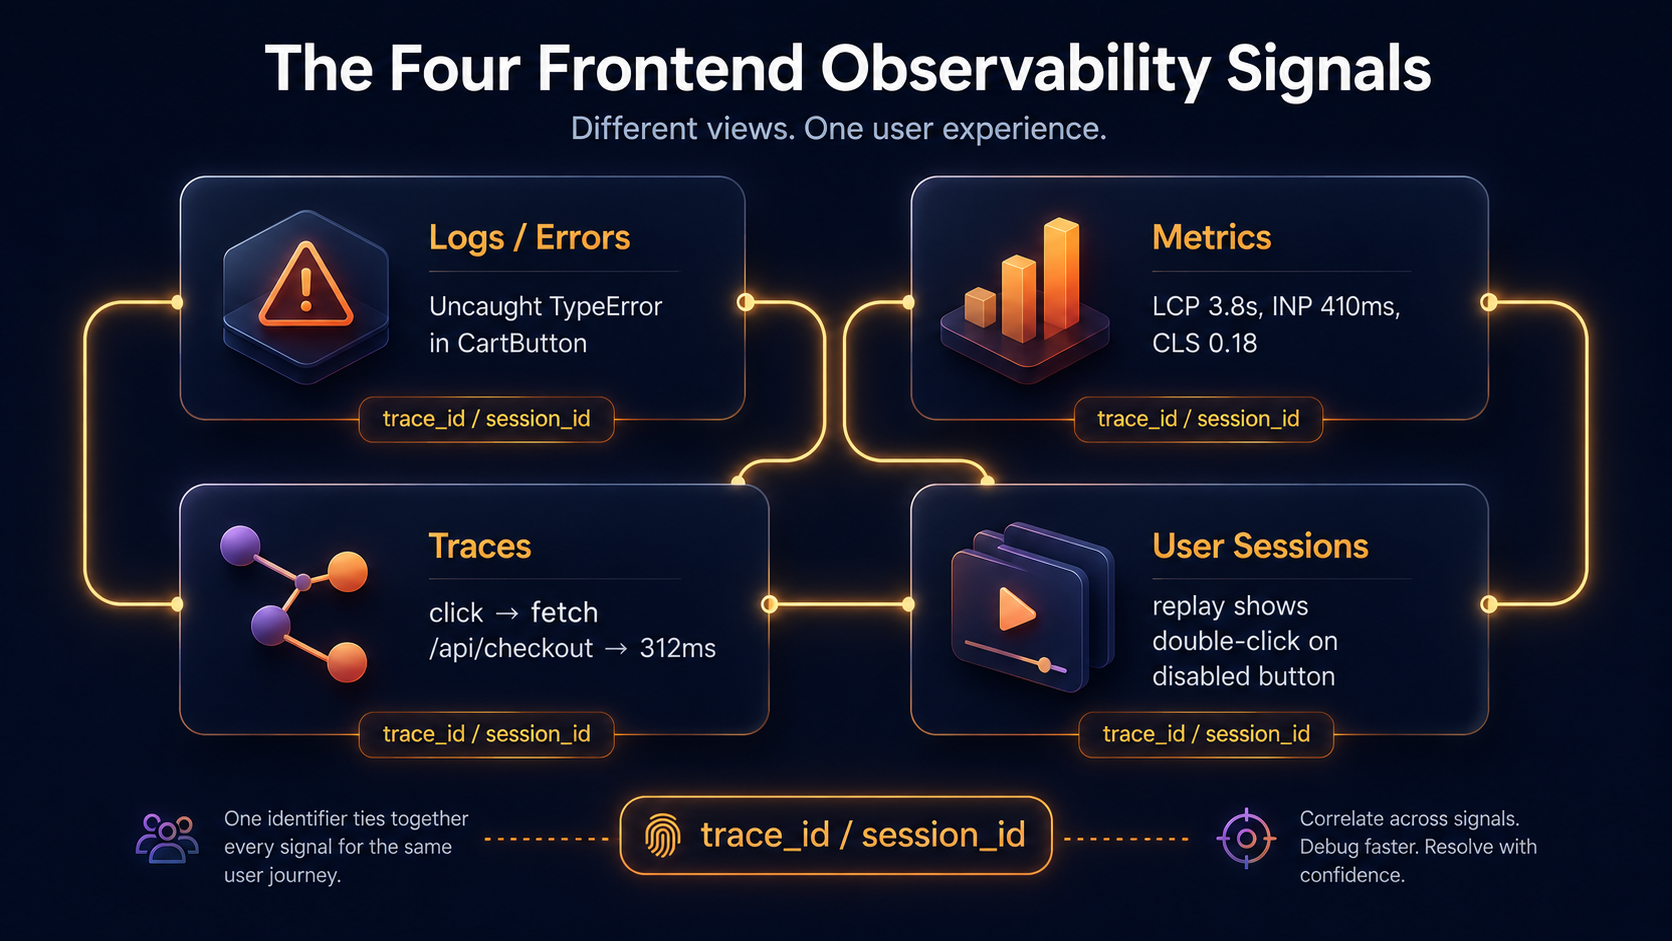
The Four Signals, On The Frontend
The classic three signals - logs, metrics, traces - are the same on the frontend as on the backend, but each of them changes shape because the runtime is the browser. There's also a fourth signal that only really makes sense on the client side: user sessions, usually delivered as session replay. You don't need all four to start; you do need to know which signal answers which question.
- Logs answer what happened. On the frontend, "log" almost always means "error event we sent to a backend collector."
console.logdoes nothing for you in production - nobody is reading the user's devtools. - Metrics answer how often and how much. On the frontend, the most useful ones are Core Web Vitals (LCP, INP, CLS) plus custom counters for things you care about, like "checkout button clicked but request never fired."
- Traces answer where the time went. A frontend trace starts on the user's click, includes the fetch to your API, and continues across your backend hops. Without that link, "the page felt slow" gets argued about forever.
- User sessions answer what the user actually saw. A session replay is the closest you'll get to sitting next to them. It's optional, expensive, and privacy-loaded, but for hard bugs it's worth every dollar.
The mental model is the same as backend: each signal is incomplete alone, the value comes from being able to pivot between them on a shared identifier - usually a trace ID or session ID - and going from "this error" to "the trace it lived in" to "the replay around it" in two clicks.
Errors: The Bare Minimum That Pays For Itself
If you do exactly one thing on this list, do this one. Catch unhandled exceptions, unhandled promise rejections, and React-style render errors, and send them home.
Without an error tracker, every frontend bug that doesn't 500 the backend is invisible. You will hear about it through support tickets, weeks after it started. With one, you see the error the first time it happens, you see how many users it hit, and you usually see the stack trace pointing to a real line in your source.
Sentry's browser SDK is the most common choice. The setup is small enough to read in one breath.
import * as Sentry from "@sentry/react";

Sentry.init({
  dsn: import.meta.env.VITE_SENTRY_DSN,
  environment: import.meta.env.MODE,
  release: import.meta.env.VITE_APP_VERSION,
  // Only send 20% of normal sessions, 100% of error sessions.
  tracesSampleRate: 0.2,
  replaysSessionSampleRate: 0.1,
  replaysOnErrorSampleRate: 1.0,
  integrations: [
    Sentry.browserTracingIntegration(),
    Sentry.replayIntegration({ maskAllText: true, blockAllMedia: true }),
  ],
});
A few things in those eight lines are doing real work. environment and release are the difference between "an error" and "an error in v2.18.3 on production for Safari 17 users." Without them, you can't tell whether a fix is deployed or whether a regression is new.
The sampling rates exist because frontend telemetry is metered. Every event is a network request from the user's browser, and the more aggressive you are, the slower their page feels and the bigger your bill gets. replaysOnErrorSampleRate: 1.0 is the trick that makes session replay actually useful - you don't record everything, you record the sessions where something went wrong.
Once errors are flowing, the second thing to do is break them apart by what the user was doing. Tagging context onto each event turns "200 TypeError events" into "200 TypeError events, all in the checkout flow, all on iOS 17.4."
import * as Sentry from "@sentry/react";

export function setUserContext(user: { id: string; plan: "free" | "pro" }) {
  Sentry.setUser({ id: user.id });
  Sentry.setTag("plan", user.plan);
}

export function withBreadcrumb(category: string, message: string, data?: object) {
  Sentry.addBreadcrumb({ category, message, level: "info", data });
}
Use setUser for the stable user id only - never email, never anything that wouldn't survive a privacy review. Use addBreadcrumb liberally; it's free and it's the difference between "the user got an error" and "the user clicked Add To Cart, then changed quantity, then got an error." When a real exception fires, the last 50 or so breadcrumbs ride along with the report.
Metrics: Core Web Vitals, Then Maybe A Few Of Your Own
The frontend metrics that matter are the ones Google standardized into Core Web Vitals, because those are also the ones users feel. Three numbers, each measuring a different kind of slow:
- LCP (Largest Contentful Paint) - how long until the main content appears. Above 2.5 seconds, users perceive the page as slow to load.
- INP (Interaction to Next Paint) - how long between the user clicking something and the page visibly responding. INP replaced FID in early 2024 because it measures the worst interaction, not the first. Above 200ms feels janky; above 500ms feels broken.
- CLS (Cumulative Layout Shift) - how much the page jumps around after it appears. Hits a real ceiling at 0.1; above 0.25 is the experience of trying to tap a button that moves at the last second.
The web-vitals library reads these straight from the browser's performance APIs and gives you a callback per metric.
import { onCLS, onINP, onLCP } from "web-vitals";

function send(metric: { name: string; value: number; id: string }) {
  // Beacon is the right choice — it survives tab close.
  navigator.sendBeacon?.(
    "/api/web-vitals",
    JSON.stringify({
      name: metric.name,
      value: metric.value,
      id: metric.id,
      url: location.pathname,
      conn: (navigator as any).connection?.effectiveType,
    }),
  );
}

onLCP(send);
onINP(send);
onCLS(send);
The navigator.sendBeacon call is the only API designed for "I want to send this even if the user is closing the tab right now." Fetch and XHR get cancelled when the page unloads. If you measure web vitals with a regular fetch, you will lose the ones that matter most - the slow sessions, the bounces, the cases where the user gave up.
You can pipe those payloads into your own time-series database, or use a hosted product. The shape doesn't matter much; what matters is that you can slice by url, connection_type, and release. The most useful chart in this whole article is "p75 LCP per route, broken out by the last seven releases." It catches the deploy that quietly broke the homepage on slow networks before users tell you.
Beyond Core Web Vitals, resist the urge to instrument everything. A few custom counters are worth more than a hundred half-useful metrics. The ones that pay back the effort:
checkout_startedvscheckout_completed- gives you a real funnel that doesn't depend on analytics.api_error_shown- counts how often the user saw an error UI, not just how often the API returned 500.feature_flag_evaluated- useful when a flag rollout coincides with a latency cliff.
Each of those is one line at the call site. The point isn't to have many metrics; it's to have metrics that someone has actually looked at this quarter.
Traces: Stitching The Browser To Your Backend
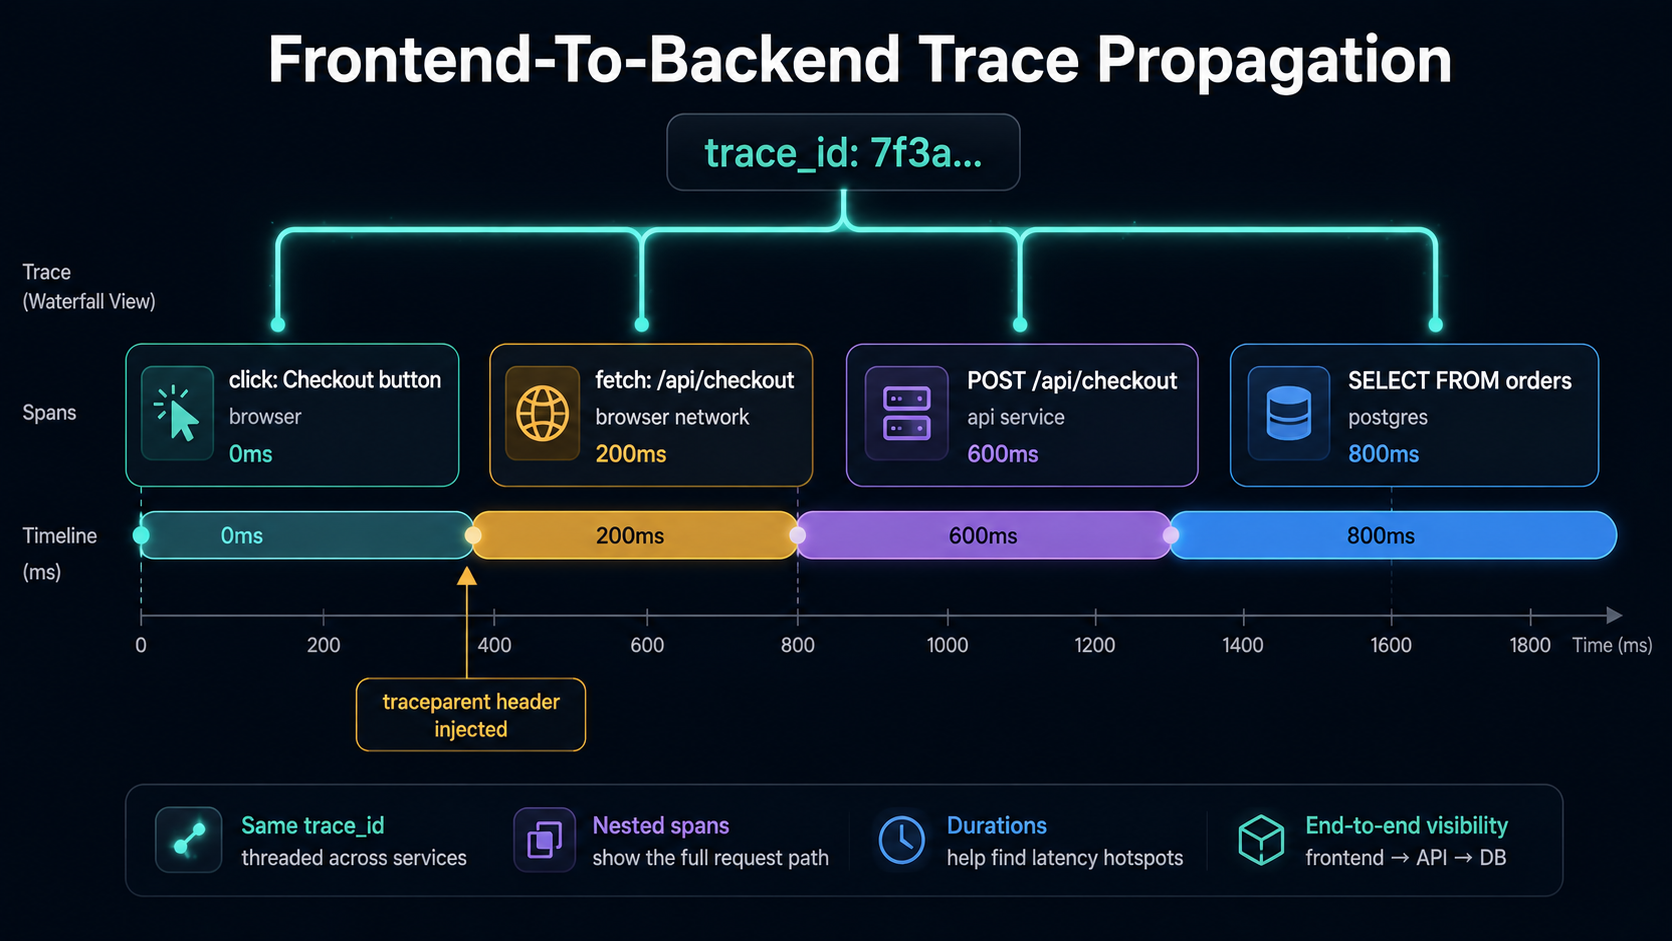
A backend-only trace can tell you that /api/checkout took 312ms. A frontend-aware trace can tell you that the user waited 1.8 seconds - 312ms in the API, 800ms downloading the response, 700ms before the React component re-rendered. Those three slices are usually invisible to backend traces because the slow part isn't on the server.
The mechanism that makes this work is trace context propagation. The frontend SDK generates a trace_id and a span_id for a top-level interaction (a click, a route change), and adds W3C traceparent headers to outgoing fetch calls. Your backend reads that header, extends the same trace, and sends spans home with the same trace_id. When you open the trace in your viewer, the browser span and the API spans live in the same waterfall.
Most teams use OpenTelemetry's browser instrumentation for this - it's the open standard and it interoperates with every collector. A minimal setup:
import { WebTracerProvider } from "@opentelemetry/sdk-trace-web";
import { BatchSpanProcessor } from "@opentelemetry/sdk-trace-base";
import { OTLPTraceExporter } from "@opentelemetry/exporter-trace-otlp-http";
import { FetchInstrumentation } from "@opentelemetry/instrumentation-fetch";
import { registerInstrumentations } from "@opentelemetry/instrumentation";
import { ZoneContextManager } from "@opentelemetry/context-zone";

const provider = new WebTracerProvider({
  resource: {
    attributes: {
      "service.name": "checkout-web",
      "service.version": import.meta.env.VITE_APP_VERSION,
    },
  } as any,
});

provider.addSpanProcessor(
  new BatchSpanProcessor(
    new OTLPTraceExporter({ url: "/otel/v1/traces" }),
  ),
);

provider.register({ contextManager: new ZoneContextManager() });

registerInstrumentations({
  instrumentations: [
    new FetchInstrumentation({
      propagateTraceHeaderCorsUrls: [/^https:\/\/api\.example\.com/],
    }),
  ],
});
A few details from those lines actually matter. propagateTraceHeaderCorsUrls is the allow-list for which endpoints get traceparent injected - by default the browser SDK won't add custom headers to cross-origin requests because the server has to opt in via CORS. If you skip this, your traces will mysteriously stop at the browser boundary on production and work fine in dev.
/otel/v1/traces is a path on your own origin that you reverse-proxy to the real collector. Sending OTLP straight from the browser to a third-party collector means CORS headaches, CSP changes, and your DSN sitting in the page source. A thin server-side passthrough avoids all three.
The backend side has to read traceparent from incoming requests and continue the trace. Every modern OTel SDK does this automatically once you register the HTTP instrumentation, but you should verify it once by checking that a single trace contains spans from both checkout-web and your backend service. If they show up as separate traces, propagation is broken - usually a CORS allow-list issue.
User Sessions: Replay, When It's Worth It
Session replay is the one signal that genuinely couldn't exist before the modern browser. The SDK records DOM mutations, CSS changes, user input events, and network calls into a compact stream, sends them home, and lets you scrub through what the user saw. Not a video - it's a reconstruction, which is why it's much smaller and zoomable.
This is the tool that ends arguments. Half the bug reports that read "it doesn't work" turn out to be one of these, and a replay lets you tell which:
- The user clicked a button that was visually present but disabled - the click went nowhere and they didn't notice.
- The user typed in a field, then another script removed focus from it, and the input was lost.
- The user hit a layout shift right before tapping a "Confirm" button - they tapped "Cancel" instead and were never told they cancelled.
- The user was on a network that returned an empty response, and your UI rendered an empty state that looked deliberate.
You'd never catch any of those four in a stack trace. Most of them don't even produce a metric. They show up only when you can watch the session.
There are real costs. Privacy is the biggest one - by default, every input field, every name, every email, every chat message in your app gets recorded. Most SDKs have aggressive masking modes that replace text with placeholder characters, and you should always start with them on. The maskAllText: true and blockAllMedia: true flags in the Sentry init above are the safe default; you opt out of masking on specific elements you've reviewed, not the other way around.
{/* Allow this label to render in replays — it's not user data. */}
<span data-sentry-unmask>Total: ${total}</span>

{/* This input contains a credit card number. Make sure it's never recorded. */}
<input data-sentry-mask autoComplete="cc-number" />
The cost is the other constraint. A 100% replay sample rate on a high-traffic app will burn through your vendor quota in days. Sample low for normal sessions (5-10%) and high for error sessions (often 100%) - the same pattern as Sentry's replaysOnErrorSampleRate. The most useful replays are always the ones around an error you didn't expect.
When a replay actually saves you a multi-day investigation, the math works out fast. When you never open the tab, you're paying for storage you don't need. Audit which replays your team actually watches every quarter; that's the metric that justifies the line item.
A Working Setup, End To End
If you wanted to wire all four signals in one weekend, the shape is roughly this:
- Drop Sentry's browser SDK in. Tag every event with
environment,release, and a stableuser.id. Send asetUsercall on login and aSentry.setUser(null)on logout. - Add
web-vitalsand send LCP, INP, and CLS to either Sentry, your own collector, or a hosted product. Filter by route and release in your charts. - Decide between Sentry tracing and OpenTelemetry browser tracing based on what your backend uses. If they don't match, you'll never link the two sides of a trace.
- Turn on session replay with full masking and a low base rate, then bump the error sample rate to 100%. Watch what comes through for two weeks before you loosen any masks.
- Wire a small
withBreadcrumbhelper into the four or five most important user actions in the app (login, route change, important button clicks, API failure handlers). Don't try to instrument everything.
Six weeks later, the test is whether you can take a bug report - "Olivia's payment failed on iOS this morning" - and answer it in under five minutes by clicking from her user ID to her last error to the trace it was inside to the replay around it. That's what these tools are for. The dashboards are a nice side effect.
What To Watch Out For
A few traps that bite teams the first time they wire frontend observability.
The bundle cost is real. Adding Sentry, web-vitals, and OpenTelemetry's browser SDKs can easily add 80-120KB gzipped to your JavaScript. That's not nothing, especially on the route the user lands on. Lazy-load what you can - the replay integration in particular is heavy and can usually be loaded after the first paint without losing much. Audit the bundle, don't just trust the docs.
Ad blockers and tracking blockers eat your beacons. A non-trivial share of users - depending on your audience, anywhere from 5% to 30% - will have an extension that blocks *.sentry.io, *.datadoghq.com, and similar domains. The fix is to proxy your telemetry endpoints through your own origin (e.g., POST /api/sentry-tunnel that forwards to Sentry). Vendors have docs for this; it's worth setting up.
Source maps are how stack traces become readable. Without source maps, a Sentry error reads TypeError at a.b.c (main-7f3.js:1:12440). With them, it reads TypeError at Cart.recalculate (src/cart/Cart.ts:48:12). Upload your source maps from CI on every deploy, and either keep them private to your error tracker or delete them from the public bundle so users can't fetch them.
Don't ship telemetry in the user's main thread. Use requestIdleCallback when you can, use sendBeacon for the close path, and batch where the SDK supports it. A library that fires 30 sync XHRs per page load is a worse user experience than no telemetry at all.
PII leaks happen quietly. A query string with ?email=alice@... gets logged, breadcrumbed, attached to a trace, and recorded in a replay - four places at once. Strip identifying query parameters at the SDK level (beforeSend hooks on Sentry, span processors on OTel), and audit your fixtures regularly. Once a piece of PII is in your telemetry store, it's in your problem.
When You Have All Four, Debugging Changes Shape
The reason any of this is worth the effort isn't the dashboards. It's that the debugging conversation changes shape. Without frontend observability, "the page is slow" turns into a multi-day investigation that ends in a shrug. With it, you go from user report to specific event to specific session in minutes, and the question you end up debating is which fix to ship - not what the bug even is.
That's the whole point. The browser is just another part of your system. You wouldn't ship a backend service with no logs, no metrics, no traces. The frontend deserves the same floor.