The first build is always beautiful. A fresh Next.js or Vite project, a clean package.json, a 90KB initial JS payload, a Lighthouse score that lights up the whole sidebar green. You take a screenshot. You feel briefly heroic.
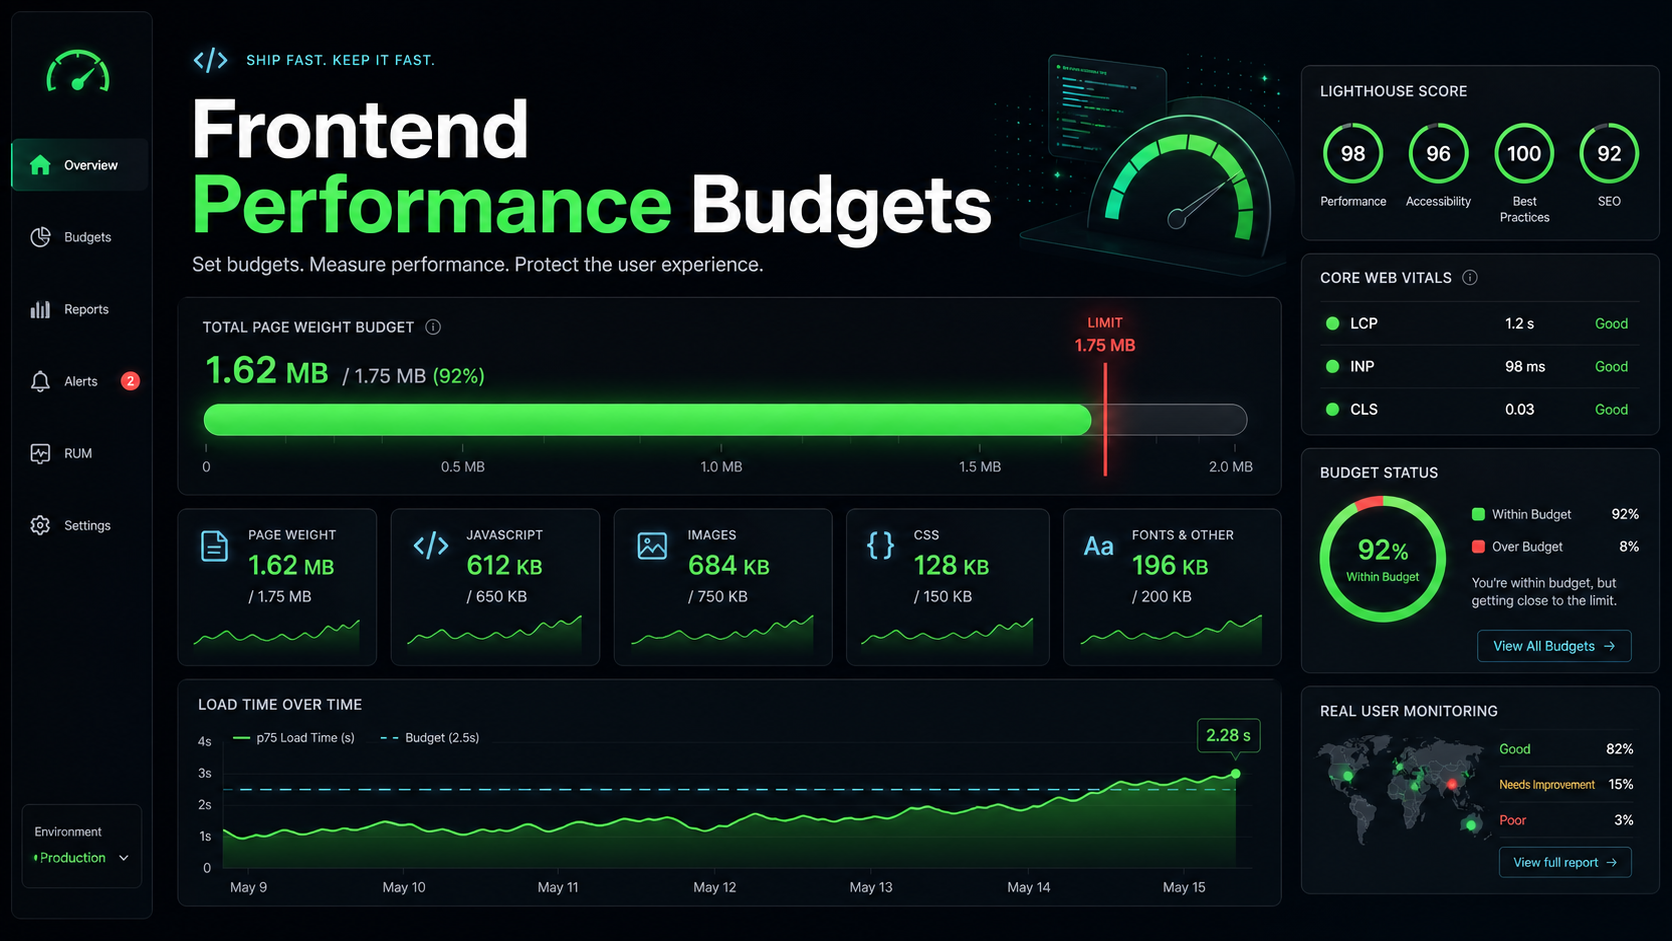
Eight months later the same app ships 1.4MB of client JavaScript on the homepage. Nobody made a bad decision in particular. A chart library here, a form library there, a date picker that brought its own locale data, a third-party feedback widget marketing insisted on. The Lighthouse score sits at 58 and your INP is, depending on the page, somewhere between disappointing and embarrassing.
Software trends toward bloat the way warehouses trend toward clutter. The teams whose apps stay fast over years are not the ones who care more — they are the ones who put hard, machine-enforced limits on what is allowed to ship. That is what a performance budget is.
A Budget Is A Tripwire, Not A Goal
A performance budget is a number that fails the build when crossed. That last clause is what separates real budgets from polite suggestions written in a README.
Useful budgets cluster around three families:
- Asset budgets. Maximum gzipped or brotli'd size for the main JS bundle, route chunks, CSS, fonts. Often expressed per route, not just for the whole app.
- Lab metric budgets. Lighthouse CI thresholds for LCP, INP, CLS, TBT, and TTFB on representative URLs.
- Field metric budgets. Real User Monitoring (RUM) p75 INP and p75 LCP — the numbers Google actually uses for Core Web Vitals.
Asset budgets give you a fast, deterministic signal in CI. Lab budgets catch the cases where a bundle stayed small but the page got slow anyway (an accidental synchronous third-party script, a giant base64 image inlined into HTML). Field budgets are the truth — they tell you what the median user actually experiences. You want all three, because each catches a different shape of regression.
Pick Numbers The Team Can Defend
Budgets fail when nobody believes them. If you set "150KB main bundle" without a reason, the first PR that needs to add a charting library will simply get the budget bumped to 280KB, and the discipline evaporates.
Anchor your numbers to user-facing thresholds. Core Web Vitals thresholds (LCP under 2.5s, INP under 200ms, CLS under 0.1) are good starting points because they are the numbers Google reports in field data. From there, work backward to asset sizes that make those vitals achievable on the slowest device and network you care about. A budget of "main route ships under 170KB of JS, gzip" is defensible if you can show that anything more pushes p75 INP over 200ms on a budget Android.
Document the why next to the number. "This is the size at which our 4G + low-end Android RUM cohort hits LCP under 2.5s" is a budget the team will defend. "We chose 150 because it is round" is a budget the team will negotiate away.
The Toolchain That Actually Works
Three tools handle the asset side of the budget, and they overlap in interesting ways.
size-limit is the friendliest for application teams. It runs your bundler, applies brotli or gzip, and compares the output against per-path limits in package.json. It also estimates download and execution time on a slow 3G + low-end mobile profile, which is the part that turns "172KB" from a number into a feeling.
"size-limit": [
  { "name": "App shell",   "path": ".next/static/chunks/main-*.js", "limit": "170 kB" },
  { "name": "Home route",  "path": ".next/static/chunks/pages/index-*.js", "limit": "55 kB" },
  { "name": "Vendor",      "path": ".next/static/chunks/framework-*.js", "limit": "90 kB" },
  { "name": "Critical CSS","path": ".next/static/css/*.css", "limit": "35 kB" }
]
bundlesize and bundlewatch play the same role with simpler glob configs and slightly different reporting. Most teams pick one and stick with it.
For the lab metric side, Lighthouse CI is the standard. It runs Lighthouse against a list of URLs from a preview deployment, asserts thresholds (largest-contentful-paint under 2500, interaction-to-next-paint under 200, etc.), and uploads the reports to a server you can browse later.
For the field side, the web-vitals library (v4 and up) reports onINP, onLCP, onCLS, onFCP, onTTFB to whatever endpoint you point it at. Most analytics platforms (Vercel, Datadog RUM, Sentry, SpeedCurve) accept these out of the box.
Wire It Into The Pull Request
Budgets only work when they fail loudly before code merges. A typical GitHub Actions setup:
name: budget
on: [pull_request]
jobs:
  size:
    runs-on: ubuntu-latest
    steps:
      - uses: actions/checkout@v4
      - uses: actions/setup-node@v4
        with: { node-version: 20 }
      - run: npm ci
      - run: npm run build
      - run: npx size-limit --json > size.json
      - uses: andresz1/size-limit-action@v1
        with: { github_token: ${{ secrets.GITHUB_TOKEN }} }
  vitals:
    runs-on: ubuntu-latest
    steps:
      - uses: actions/checkout@v4
      - uses: treosh/lighthouse-ci-action@v11
        with:
          urls: |
            https://preview-${{ github.event.number }}.example.com/
            https://preview-${{ github.event.number }}.example.com/pricing
          configPath: ./.lighthouserc.json
          uploadArtifacts: true
The size-limit-action step is the small detail that gets developer buy-in. It posts a comment on the PR showing diff vs. main, broken down by chunk: "main bundle +12.4KB (over budget by 4.2KB)." Now the conversation is concrete instead of abstract — the reviewer can see exactly which import bloated which file.

When The Budget Breaks, Reach For The Analyzer
A red CI status is information, not a fix. The follow-up question is always "where did this weight come from?" Bundle analyzers answer that.
For Next.js, @next/bundle-analyzer wraps your config and renders a treemap of every chunk after a build. You can spot the obvious shapes: a single 280KB rectangle for moment you forgot you installed, two react-dom boxes because a UI library ships its own copy, an entire SVG icon set imported wholesale.
For Vite and Rollup, the equivalent is rollup-plugin-visualizer, which produces the same treemap from the rollup output. For Webpack-based projects, the original webpack-bundle-analyzer still works.
The pattern of fixes that come out of these audits is consistent: switch from lodash to per-function imports or lodash-es with tree shaking; replace moment with date-fns or Intl.DateTimeFormat; lazy-load heavy widgets via next/dynamic or import(); deduplicate React versions in a monorepo by hoisting; move build-time content rendering off the client.
Budgets Make Tradeoffs Negotiable
The political function of a performance budget is at least as valuable as the technical one. Without a budget, "we should add this analytics SDK" is a one-sided ask — the marketing team gets the feature they want, and the perf cost gets quietly distributed across all users. With a budget, the cost shows up on a screen and forces a decision.
The conversation changes from "should we add it?" to "we have 30KB of headroom. This SDK is 90KB. Either we lazy-load it, swap something out, or explicitly raise the budget — and if we raise it, we accept the LCP regression we projected." That is a productive conversation. It moves performance from a vague engineering preference to a measurable constraint everyone in the org can reason about.
Treat The Budget Like A Living Document
The budget is not set once and forgotten. As the product evolves, you will:
- Tighten budgets that have headroom you can give back to the user. If you launched at 170KB and a refactor took you to 130KB, drop the limit before someone fills the gap.
- Loosen budgets when a genuine new requirement justifies it — but only after exhausting the alternatives, and only with the corresponding RUM commitment to verify the user impact.
- Add new budgets as new routes ship. A standalone heavy admin route can have its own limit; do not hide its weight inside the global app shell number.
The teams I see succeed treat their budget file the same way they treat their lockfile — checked in, reviewed in PRs, regenerated only with intent. The teams that fail treat it as an aspirational comment, then wonder six months later how the homepage got to 1.4MB. The difference is not talent. It is the tripwire.