
So, you've written some Go. You probably love it. The syntax is small, the standard library is excellent, and the runtime hands you concurrency primitives that other languages charge tuition for. And one day you open a CPU profile and there's a fat purple block at the top labeled runtime.mallocgc. Or you tick the memory chart on your dashboard and the sawtooth has gotten taller. Or someone in code review asks "wait, does that escape?" and you realize you're not entirely sure what that means.
Go markets itself as a language you don't have to think about memory in. That's mostly true, in the sense that you'll never free() anything and you'll never read a segfault dump at 2am. It's not true in the sense of "you can ignore memory and your service will be fast." A few bad lines can turn a hot loop into a garbage-collected allocation festival, and the runtime won't warn you. It'll just quietly chew CPU on mallocgc and runtime.scanobject.
This article is a long walk through what Go actually does with your memory, from the compile-time decisions to the runtime ones. We'll cover where variables live (stack vs heap), how the compiler decides (escape analysis), how the garbage collector works (concurrent tri-color mark-sweep with a pacer), how allocations actually happen, and how to use pprof, runtime/trace, and a handful of small tools to find the allocations you care about. By the end you should be able to look at a piece of Go and have a reasonable guess at whether it allocates, and, more usefully, know how to check.
Everything stays in Go. The topic is a Go-specific topic.
Stack and heap, from Go's point of view
Before any of the cleverness, the basics, with the parts that actually matter when you're writing Go.
Every running goroutine has a stack. Stacks in Go are small (since 1.4, the default starts at 2 KB) and grow on demand. When a function is called, a new stack frame is pushed; when it returns, the frame is popped and the memory is reclaimed instantly with no GC involvement at all. This is the cheapest possible memory: allocation is "move the stack pointer," deallocation is "move it back."
The heap is the shared region where everything else lives: anything that needs to outlive a single function call, or anything the compiler can't prove won't. Heap allocations cost more (you call into the allocator), and the cleanup costs more. The garbage collector has to find those allocations later and decide whether they're still live.
The wrinkle that makes Go interesting is that you don't choose. There's no new vs make decision that maps to stack vs heap, and &x doesn't mean "put x on the heap." Take the address of a local in C and it's stack; take the address of a local in Go and the compiler decides. The decision is called escape analysis, and it happens at compile time.
Here's a quick way to see it for yourself. Drop this into a file:
package main

import "fmt"

type Point struct{ X, Y int }

func makeStack() Point {
    return Point{X: 1, Y: 2}
}

func makeHeap() *Point {
    return &Point{X: 1, Y: 2}
}

func main() {
    a := makeStack()
    b := makeHeap()
    fmt.Println(a, b)
}
Run it with the compiler's escape analysis flag:
go build -gcflags="-m" ./...You'll see something like:
./example.go:11:9: &Point{...} escapes to heap
./example.go:7:6: can inline makeStack
./example.go:11:6: can inline makeHeap
./example.go:16:18: ... argument does not escape
makeStack returns the struct by value. The caller gets a copy, the original frame disappears, no problem. makeHeap returns a pointer to a struct created inside the function. If the compiler put that struct on the stack, the returned pointer would dangle the moment makeHeap returned. So the compiler "escapes" it to the heap, where the GC will eventually clean it up.
That's the whole game, really. The compiler tries to keep things on the stack. When it can't, they escape.
Escape analysis, in detail
Reading -m output is genuinely useful, but it's more useful once you know the patterns it's checking for. Let's walk the common ones.
1. Returning a pointer to a local
The simplest case. If you take &local and return it (or assign it somewhere that outlives the function), it has to escape.
type User struct {
    ID   int64
    Name string
}

func newUser(id int64, name string) *User {
    return &User{ID: id, Name: name} // escapes
}
This is fine. It's idiomatic Go. The constructor pattern returns a pointer because callers want a mutable, identity-bearing value. Don't try to "fix" this by returning by value if you genuinely need a pointer; you'd just push the copy cost onto every caller.
2. Storing into an interface
This one trips people up. When you assign a concrete value to an interface variable, the runtime needs to store both a type pointer and a value pointer. If the value fits in a word and isn't a pointer, Go used to inline it, but as of modern releases interfaces almost always box the value onto the heap.
func log(v any) {
    fmt.Println(v)
}

func caller() {
    x := 42
    log(x) // x escapes to heap because it's converted to `any`
}
That little log(x) allocates. In a hot loop it can dominate your CPU profile, and the cause isn't obvious from the call site.
go build -gcflags="-m" ./...
# ./main.go:NN:NN: x escapes to heap
The fmt package is particularly bad here because it takes ...any, and the slice itself plus every element gets boxed. log/slog and zap exist in part because they let you pass typed key-value pairs without the boxing.
3. Closures that escape
A closure captures variables by reference. If the closure itself escapes (stored somewhere, returned, passed to a goroutine), every captured variable escapes too.
func counter() func() int {
    n := 0
    return func() int {
        n++
        return n
    }
}
n escapes because the closure outlives counter. That's the whole point of a closure, and it's correct. But the same machinery costs you when you didn't mean for it to.
func process(items []Item) {
    for _, item := range items {
        go func() {
            handle(item) // captures `item` — may escape
        }()
    }
}
The goroutine's closure captures item. Even in modern Go where the loop variable's scope was fixed (Go 1.22), the captured value escapes to the heap because the goroutine's lifetime is unbounded. Pass the value explicitly if you want to be sure:
for _, item := range items {
    go handle(item) // value passed by argument; cleaner
}
4. Slices and maps that grow past compile-time-known size
If the compiler can see the size, the backing array can live on the stack. If it can't, the slice escapes.
func small() {
    s := make([]int, 8) // stack-allocated backing array
    _ = s
}

func dynamic(n int) {
    s := make([]int, n) // escapes — size depends on n
    _ = s
}
The compiler's threshold isn't documented as a fixed number, and it's evolved across Go versions, but the rule of thumb is: small, constant-size slices/arrays may live on the stack; anything sized at runtime or larger than a small threshold goes on the heap.
Maps almost always escape. The runtime's map structure is too dynamic to keep on a stack frame.
5. Self-referential or "address taken" patterns
Anything where the compiler can't reason about lifetimes tends to escape: taking an address and storing it in another struct's field, passing it to a function whose signature accepts a pointer that might be retained, returning a pointer through a method on a struct.
A particularly sneaky one: when you assign &x into a slice or map, the value escapes because the container outlives the function frame in general.
func collect(out *[]*int, x int) {
    *out = append(*out, &x) // x escapes
}
Reading -gcflags="-m" like a reasonable person
The output is firehose-shaped at first. A few practical moves:
# show escape decisions
go build -gcflags="-m" ./mypkg

# more detailed — shows why
go build -gcflags="-m -m" ./mypkg

# inlining decisions, useful alongside
go build -gcflags="-m=2" ./mypkg

# for a single function, grep is your friend
go build -gcflags="-m" ./mypkg 2>&1 | grep "ProcessOrder"
Don't try to read the whole package's output. Build it, grep for the function you suspect, and look at the decisions for that function. Most lines say "does not escape" or "leaks to {return}", which is fine. The lines you care about say "escapes to heap" or "moved to heap."
The garbage collector
Once values are on the heap, they need cleaning up. Go's garbage collector has gone through several rewrites; what's worth knowing about today's version (Go 1.5 onward, refined heavily through the 1.x line) is:
- It's concurrent: it runs alongside your program, not by pausing it.
- It's non-moving: objects don't change addresses, which is why taking pointers everywhere is safe and why Go can interop cleanly with C.
- It's a tri-color mark-sweep collector with write barriers to track changes the program makes during the mark phase.
- It's non-generational: no young-generation vs old-generation split like in the JVM. The whole heap is one space, and the GC works on all of it each cycle. (There have been generational experiments and there's ongoing work; as of writing, mainline Go is still single-generation.)
- It's paced by a control loop that aims to keep heap growth proportional to live data, governed by
GOGCand, since Go 1.19, optionally byGOMEMLIMIT.
That's a lot of words. Let's actually walk through what happens.
A cycle, end to end
A GC cycle has roughly four phases:
- Sweep termination (STW). A short stop-the-world that finishes the previous cycle's sweep. The pause is on the order of microseconds in healthy programs.
- Mark phase (concurrent). The GC walks the object graph starting from roots (goroutine stacks, globals, registers), marking everything reachable. Your program keeps running. While it runs, write barriers record any pointer writes so the GC doesn't miss an object that got reattached to the live set during the mark.
- Mark termination (STW). Another short stop-the-world to finish the mark phase: flush the write barrier buffers, finalize the mark bits. Again, typically microseconds.
- Sweep phase (concurrent). The runtime walks the heap and reclaims memory from objects that weren't marked. This is lazy and incremental; your goroutines participate in sweeping as they allocate.
The "tri-color" name refers to how marking is tracked:
- White: not yet visited, presumed garbage.
- Grey: visited but its children haven't been scanned.
- Black: visited and all its children scanned.
The invariant the GC maintains is: a black object never points to a white object. Without that invariant, the concurrent mutator could let a live object slip back into the "garbage" set by rewiring a pointer the GC has already passed. The write barrier exists exactly to maintain this invariant.
Go uses a hybrid write barrier (Dijkstra-style combined with Yuasa-style, introduced in Go 1.8) so that goroutine stacks don't have to be rescanned during the mark termination STW. The practical consequence is that mark termination pauses got dramatically shorter starting in 1.8, sub-millisecond on most workloads.
The pacer
The pacer is the part that decides when to start a GC cycle. The goal is roughly: trigger the next cycle so it finishes around when the heap has grown by GOGC% since the previous cycle's live size.
GOGC is a percentage. Default is 100, meaning "let the heap roughly double between cycles." Set it to 50 and you'll GC more often (more CPU on GC, smaller average heap). Set it to 200 and you'll GC less often (less CPU on GC, larger average heap). Set it to off and the GC won't run at all, useful for batch tools where the process exits before memory matters.
GOGC=200 ./myserver
GOGC=off ./mybatchtool
GOMEMLIMIT (Go 1.19+) sets a soft memory limit. If the heap is approaching the limit, the pacer will pull GC cycles forward so the limit isn't blown. It's the right knob for containerized services where you have a hard memory cap and you'd rather GC harder than get OOM-killed.
GOMEMLIMIT=4GiB ./myserverYou can set both. GOGC controls the steady-state behavior; GOMEMLIMIT is the safety net.
What the GC pause actually looks like
The common myth is "Go has GC pauses, that's bad." The reality on modern Go is:
- STW pauses (sweep termination + mark termination) are typically sub-millisecond, often in tens of microseconds, on most workloads.
- The bulk of GC work is concurrent: it competes with your program for CPU, but it doesn't stop it.
- A bad GC profile is much more often "we're doing GC all the time because we allocate constantly" than "GC pauses are too long."
You can see pauses for yourself via runtime.MemStats.PauseNs (a rolling buffer of recent pause durations) or by setting GODEBUG=gctrace=1 and reading the lines the runtime prints:
GODEBUG=gctrace=1 ./myserver 2>&1 | headA line looks like:
gc 12 @1.234s 4%: 0.018+1.4+0.030 ms clock, 0.15+0.50/1.3/0.0+0.24 ms cpu, 50->52->27 MB, 53 MB goal, 8 PThe fields you'll actually look at: the three time values (sweep-term STW + concurrent mark + mark-term STW), the heap-size triple (start->peak->end), and the percentage of CPU spent in GC. If that percentage climbs past 10%, you have an allocation problem, not a GC problem.

Where allocations actually come from
Once you know the GC exists, the natural next question is: how do I make it do less work? And the answer is almost always: allocate less.
Here's a short tour of the places allocations sneak into Go code, with the patterns that cause them and the small changes that don't.
Interface boxing (already covered, but worth repeating)
Any time a concrete value is assigned to an interface, the value is boxed onto the heap (with rare exceptions for tiny values; don't rely on the exceptions). The biggest source of this in real code is the fmt family, log, and any function with ...any.
// allocates: every numeric and string argument boxes
log.Printf("user=%d action=%s amount=%d", userID, action, amount)

// allocates much less: structured loggers with typed fields
logger.Info("event",
    slog.Int64("user", userID),
    slog.String("action", action),
    slog.Int64("amount", amount),
)
In hot paths, prefer typed logging APIs.
String concatenation
a + b + c + d allocates a new string at each +. If you're building a string in a loop or from many parts, use strings.Builder:
var b strings.Builder
b.Grow(estimatedLen) // optional but worth it if you can estimate
for _, part := range parts {
    b.WriteString(part)
}
result := b.String()
For byte-level building, bytes.Buffer is the equivalent.
Slice growth
append will copy the backing array when capacity is exceeded. If you know the final size, pre-allocate:
// unhappy: many reallocations as the slice grows
var out []Result
for _, x := range input {
    out = append(out, process(x))
}

// happy: one allocation
out := make([]Result, 0, len(input))
for _, x := range input {
    out = append(out, process(x))
}
If you really want to be slick, make([]Result, len(input)) and index into it directly. Skips the bounds-check-and-grow path entirely.
Map growth
Same idea. Give make a size hint:
m := make(map[string]int, len(input))The hint is advisory; the runtime may round up. But it avoids a few reallocations and rehashings as the map grows.
Method values vs method expressions
A method value (obj.Method) captures the receiver, which means it may allocate.
fn := obj.DoThing // allocates a closure that captures objIf you're passing this around in a hot loop, consider passing obj and calling .DoThing() at the call site instead.
Defer (mostly fine, sometimes not)
Modern Go (1.14+) has "open-coded defers" that don't allocate for the common case: a small fixed number of defers at function-scope. If you defer inside a loop, or have many defers in one function, you're more likely to hit the heap-allocated defer path.
// fine
func handle(r *http.Request) {
    defer r.Body.Close()
    ...
}

// suspicious — defer inside a loop allocates per iteration
for _, file := range files {
    f, _ := os.Open(file)
    defer f.Close() // also a real bug: defers run at function return
    ...
}
The pattern in the second snippet is a bug as well as an allocation. Refactor to a helper function so each defer is scoped to one open.
Reflection
Anything that goes through reflect tends to allocate. Marshaling JSON with the standard library, for example, allocates a lot: it walks types via reflection, boxes values, builds intermediate buffers. For hot paths, a code-generated serializer (e.g., easyjson, sonic) or a manual one will often cut allocations by 10x.
This is the kind of trade-off where you don't optimize until you've measured. Most services should ship with encoding/json and only swap when a profile says so.
A small, evil example
To make the cost concrete, here's a tiny function with a hidden allocation:
func formatID(id int64) string {
    return fmt.Sprintf("user-%d", id)
}
In a hot loop, this allocates twice per call: once for the any boxing of id, once for the result string. The faster version:
func formatID(id int64) string {
    return "user-" + strconv.FormatInt(id, 10)
}
Roughly half the allocations. In the kind of code path that runs a million times per second, that's measurable.
But, and this is the part that matters, don't rewrite all your fmt.Sprintfs without measuring. In a code path that runs ten times per request, you'll save microseconds at best and you'll make the code worse. Reach for the hand-rolled version only when a profile points at it.
Profiling: where the allocations are
You can't optimize what you don't measure. Go's profiler is excellent and underused. Here's how to use it for memory questions specifically.
Profile sources
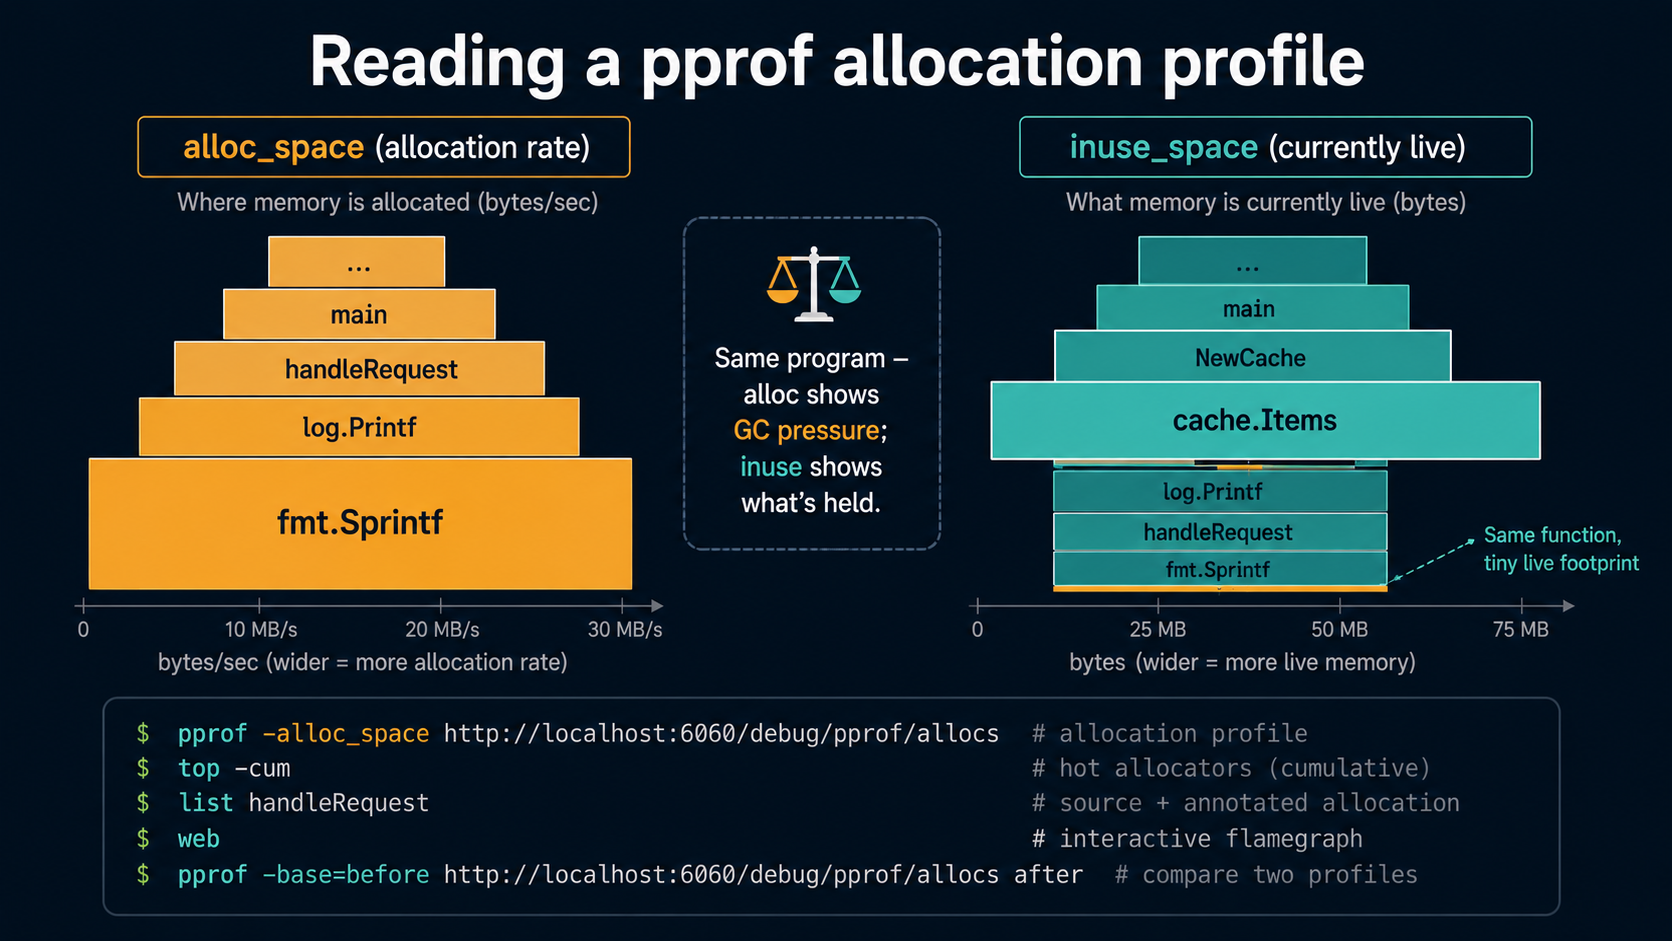
Go gives you four allocation profiles via pprof:
alloc_objects: count of objects allocated since the program started.alloc_space: bytes allocated since the program started.inuse_objects: count of objects currently live (i.e., reachable as of the most recent GC).inuse_space: bytes currently live.
alloc_* answers "what is doing the allocating?" Useful for hunting allocation hotspots that drive GC pressure.
inuse_* answers "what is holding onto memory?" Useful for memory leaks and high resident set size.
Most performance work uses alloc_space. Most leak hunts use inuse_space.
Grabbing a profile
In a service, mount net/http/pprof:
import _ "net/http/pprof"

func main() {
    go func() {
        log.Println(http.ListenAndServe("localhost:6060", nil))
    }()
    // ... rest of the service
}
Then:
# allocation rate profile (since process start)
go tool pprof http://localhost:6060/debug/pprof/allocs

# currently-live heap profile
go tool pprof http://localhost:6060/debug/pprof/heap

# you can also pass -alloc_space or -inuse_space explicitly
go tool pprof -alloc_space http://localhost:6060/debug/pprof/allocs
Inside the pprof prompt, the moves you'll use 80% of the time:
(pprof) top                # top by flat allocations
(pprof) top -cum           # top by cumulative (includes callees)
(pprof) list MyFunc        # source-level annotated view of MyFunc
(pprof) web                # opens an SVG flamegraph in your browser
(pprof) traces             # call traces with sample counts
For benchmarks, the workflow is similar but offline:
go test -bench=. -benchmem -memprofile=mem.out ./mypkg
go tool pprof -alloc_space mem.out
-benchmem adds the "B/op" and "allocs/op" columns to benchmark output, which is often enough to spot a problem without firing up pprof at all.
BenchmarkFormatID-8        20000000     78.4 ns/op    24 B/op     2 allocs/op
BenchmarkFormatIDFast-8    30000000     45.1 ns/op    16 B/op     1 allocs/op
Two allocs per op → one alloc per op. That's the kind of delta worth keeping.
Reading a profile without getting lost
The first time you open a pprof flamegraph, the temptation is to look at the biggest box and conclude "that's the problem." Sometimes it is. Often it isn't. A few rules of thumb:
- Allocation profiles are about who creates objects. A big block at
mallocgcis not the bug. It's the receiver. Look at who's calling it. top -cumshows you the path, not the leaf. A function that does very little itself but calls allocation-heavy code will dominate cumulative, and that's usually where you want to make a change.- The
inuseprofile and theallocprofile can disagree. A function might allocate a billion small short-lived objects (hugealloc_*) but hold nothing live (tinyinuse_*). That's a GC-pressure problem, not a memory leak. - Compare profiles, don't read one in isolation.
pprof -base=before.out after.outshows you what changed between two profiles. This is the move when investigating a regression.
runtime/trace for the timeline view
pprof shows you what allocated. runtime/trace shows you when, in a per-goroutine timeline that includes GC cycles, scheduler events, syscalls, and network blocking.
import "runtime/trace"

f, _ := os.Create("trace.out")
trace.Start(f)
defer trace.Stop()
// ... do work
Then:
go tool trace trace.outThis opens a browser UI. The views you'll actually use:
- Goroutine analysis: find which goroutines are spending time blocked vs running.
- GC visualization: see GC cycles laid over your workload.
- Scheduler latency profile: find goroutines that wait a long time to be scheduled.
The cost is real (running with trace.Start slows things down measurably; don't enable it in steady-state production), but for a 5-second window during a load test, it's gold.
runtime.MemStats, for quick checks
If you just want a number (bytes allocated, last GC time, current heap size), runtime.ReadMemStats is a synchronous, in-process call:
var ms runtime.MemStats
runtime.ReadMemStats(&ms)
fmt.Printf("HeapAlloc=%d HeapInuse=%d NumGC=%d\n",
    ms.HeapAlloc, ms.HeapInuse, ms.NumGC)
It's a real runtime call. It stops the world briefly to read consistent values, so don't put it on a hot path. But for periodic dashboards or post-test summaries, it's fine and it's the source of truth for most of the numbers your APM agent reports.
Practical knobs and patterns
A grab-bag of moves that actually move the needle when a profile points you at them.
sync.Pool for reusable buffers
sync.Pool lets you cache and reuse allocated objects across requests, amortizing the allocation cost. The classic use is a request-scoped byte buffer:
var bufPool = sync.Pool{
    New: func() any {
        return new(bytes.Buffer)
    },
}

func handle(w http.ResponseWriter, r *http.Request) {
    buf := bufPool.Get().(*bytes.Buffer)
    defer func() {
        buf.Reset()
        bufPool.Put(buf)
    }()
    // ... use buf
}
Two things to know about sync.Pool:
- The pool can drop entries at any GC, including the one happening right now. It's not a long-term cache; it's a short-term reuse buffer. Don't put expensive-to-construct values in there expecting them to stick around.
- Always reset state before putting an item back. A
bytes.Bufferthat still has the previous request's data in it is a security incident waiting to happen.
sync.Pool is one of those features that's genuinely useful in the right place and useless or harmful in the wrong one. Reach for it when a profile shows allocations of a specific type dominating, and those allocations are short-lived enough that a pool will see good hit rates.
Pre-allocate slices and maps you'll fill
Already mentioned, but worth its own line: if you know the size, tell make.
out := make([]Result, 0, len(input))
m := make(map[string]int, len(input))
This single habit accounts for a lot of the easy wins in real codebases.
Avoid retaining big backing arrays through small slices
This one bites people:
func firstFive(data []byte) []byte {
    return data[:5]
}
The returned slice is 5 bytes wide, but it points at the original backing array. If data was 10MB and the caller stores the returned slice somewhere long-lived, all 10MB stay alive. The GC can't collect the backing array because the small slice still references it.
The fix: copy.
func firstFive(data []byte) []byte {
    out := make([]byte, 5)
    copy(out, data)
    return out
}
Same shape, no retention.
Struct field order
Go aligns struct fields on their natural boundaries. A struct with fields in a bad order has padding bytes the compiler inserts to satisfy alignment. Reordering fields by size (largest to smallest) often shrinks the struct.
// 24 bytes (with padding)
type BadOrder struct {
    a bool   // 1 byte + 7 padding to align b
    b int64  // 8 bytes
    c bool   // 1 byte + 7 padding (struct is rounded up)
}

// 16 bytes
type GoodOrder struct {
    b int64  // 8 bytes
    a bool   // 1 byte
    c bool   // 1 byte + 6 padding
}
For one struct, who cares. For a slice of a million of them, you just saved 8MB. Tools like fieldalignment (part of golang.org/x/tools) will tell you which structs to reorder.
go install golang.org/x/tools/go/analysis/passes/fieldalignment/cmd/fieldalignment@latest
fieldalignment ./...
make([]T, n) vs make([]T, 0, n)
These look similar and behave differently. make([]T, n) gives you a slice of length n, fully zeroed. make([]T, 0, n) gives you a slice of length 0 and capacity n. If you're going to fill in by index, use the first. If you're going to append, use the second. Mixing them up is a common source of subtle bugs (writing past length, or appending and silently doubling the allocation).
Read the allocation column on your benchmarks
go test -bench=. -benchmem should be the default for any benchmark you commit. The CPU time matters. The allocation count often matters more: it predicts how the function will behave under GC pressure, which is where most production performance lives.
A function that's 20% faster but allocates 3x more is usually a loss in a service, even if the microbenchmark says it's a win. Trust the alloc column.
When to actually care
Most Go code doesn't need any of this. The compiler does a competent job, the GC is fast, and "premature optimization" applies to memory the same way it applies to CPU.
The cases where this article earns its length:
- Hot paths in services: the inner loop of a request handler, a parser, a serializer. Anything that runs millions of times per minute.
- Latency-sensitive code: anything where a 5ms GC pause matters, like real-time bidding, game servers, or low-latency trading bits.
- Memory-constrained environments: containers with tight limits, edge nodes, embedded-ish Go.
- Investigating a regression: your service was fine, then it wasn't. Allocation profiles and
gctrace=1are usually the fastest way to find out what changed.
For everything else: write the code that reads well, ship it, and check a profile if it's slow. Most of the time the answer isn't "rewrite this with sync.Pool." It's "you're making a database call inside a loop" or "this regex is being recompiled per request." Memory is one tool in the box, not the whole box.
But when memory is the problem, knowing where allocations come from, how the GC schedules its work, and how to read pprof is the difference between staring at a chart and fixing the chart. The runtime gives you all the visibility you need; you just have to ask.
So next time someone in a review asks "wait, does that escape?" Pull up -gcflags="-m", point at the line, and tell them exactly what the compiler decided. That's the energy.