There's a stage every Node service goes through. Day one: console.log('user', user). Day thirty: console.log('user', user, 'request', req.id). Day ninety: a thousand-line search through Datadog trying to figure out which of seventeen "failed to update" lines belongs to the customer who DM'd support.
Logging is one of those things that costs almost nothing to do right at the start and a lot to retrofit later. The good news is the gap between "broken" and "great" is mostly one library and one middleware.
Why console.log Stops Working
console.log writes a string to stdout. Your log aggregator wants JSON. So you (or your aggregator) end up parsing strings — losing types, losing structure, and sometimes losing whole fields when a comma sneaks into a username.
Structured logs flip the contract: every log line is one JSON object, every field has a name, the aggregator stores them as columns, and you can filter on them. userId = "u_42" instead of grepping for "user u_42".
// before
console.log('order created', orderId, total, userId);

// after
log.info({ event: 'order.created', orderId, total, userId }, 'order created');
Same information. The second one you can filter, alert on, correlate, and aggregate. The first you can read in a terminal, and that's it.
Pick Pino, Move On
In 2024, pino is the dominant fast structured logger for Node. It writes JSON to stdout, supports child loggers for context, has built-in redaction for secrets, and doesn't block the event loop on writes. Winston is the older alternative — slower, more flexible, and what you'll inherit in legacy codebases. Bunyan is the previous generation; you'll see it occasionally.
For a new service: pin pino, configure it once, never touch it again.
import pino from 'pino';

export const logger = pino({
  level: process.env.LOG_LEVEL ?? 'info',
  base: {
    service: 'billing-api',
    env: process.env.NODE_ENV,
    version: process.env.GIT_SHA?.slice(0, 7),
  },
  redact: {
    paths: ['req.headers.authorization', 'req.headers.cookie', '*.password', '*.token'],
    censor: '[REDACTED]',
  },
});
base is metadata stamped on every line. redact quietly removes secrets so a sloppy log call can't leak an API key.
For local dev, pipe to pino-pretty for human-readable output: node dist/server.js | pino-pretty. Don't enable pretty-printing in production — it's slower and your aggregator wants the raw JSON.
Correlation IDs Tie Everything Together
A request walks through your service touching maybe ten log calls. Without a shared ID, those ten lines are unrelated dots in a stream of millions. With one ID, they're a story.
import { logger } from '../logger';

export function requestContext(req, res, next) {
  req.id = req.header('x-request-id') ?? crypto.randomUUID();
  req.log = logger.child({ requestId: req.id, path: req.path, method: req.method });
  res.setHeader('x-request-id', req.id);
  next();
}
Now every handler uses req.log.info(...) instead of the global logger, and every line carries requestId automatically. Pass the ID through to downstream HTTP calls (x-request-id header) and you can trace one user's request across three services.
If you use pino-http, you get this plus per-request access logs (status, duration, response size) for free — bind it after requestContext and you have most of an "access log" stack in two lines.
Levels Mean Something
A logger that uses info for everything is just a console.log with extra steps. The levels are a vocabulary — use them.
fatal— the process is going to die.unhandledRejection,uncaughtException. Page someone.error— a bug or an unexpected failure. A 500 happened. Alert on the rate.warn— operational, expected, but worth tracking. Rate limited, validation failed, retry triggered.info— normal lifecycle events. Server started, job completed, user signed up.debug— detail useful when troubleshooting, off by default in production.trace— extremely verbose, almost never on.
Pick a default level (info in prod, debug in dev), and let LOG_LEVEL override it without redeploying. The discipline is mostly about not crying wolf — if error fires for a 404, your alerting is useless.

What To Log, And What Not To
A useful log line answers: who, what, when, where, and how long. Useful events for an HTTP service:
- Request started / completed — method, path, status, duration, requestId, userId.
- Auth decisions — token verified, token rejected (with the reason class, not the token).
- Business events —
order.created,payment.refunded,subscription.upgraded. Use a stableeventfield; aggregators love it. - External calls — outbound URL host, status, duration. Times out? Log it.
- Errors — always. Always with the request context.
What not to log: passwords, tokens, full credit card numbers, raw PII unless you've classified it, the entire request body unconditionally, gigantic objects. Use the redact config so a careless req.log.info({ req }, ...) can't leak headers.
A note on volume: every log line costs storage and money. A web service logging at info typically produces a few KB per request. A service logging at debug for every DB call produces gigabytes per day per pod. Plan accordingly — debug should be opt-in for an incident, not the default.
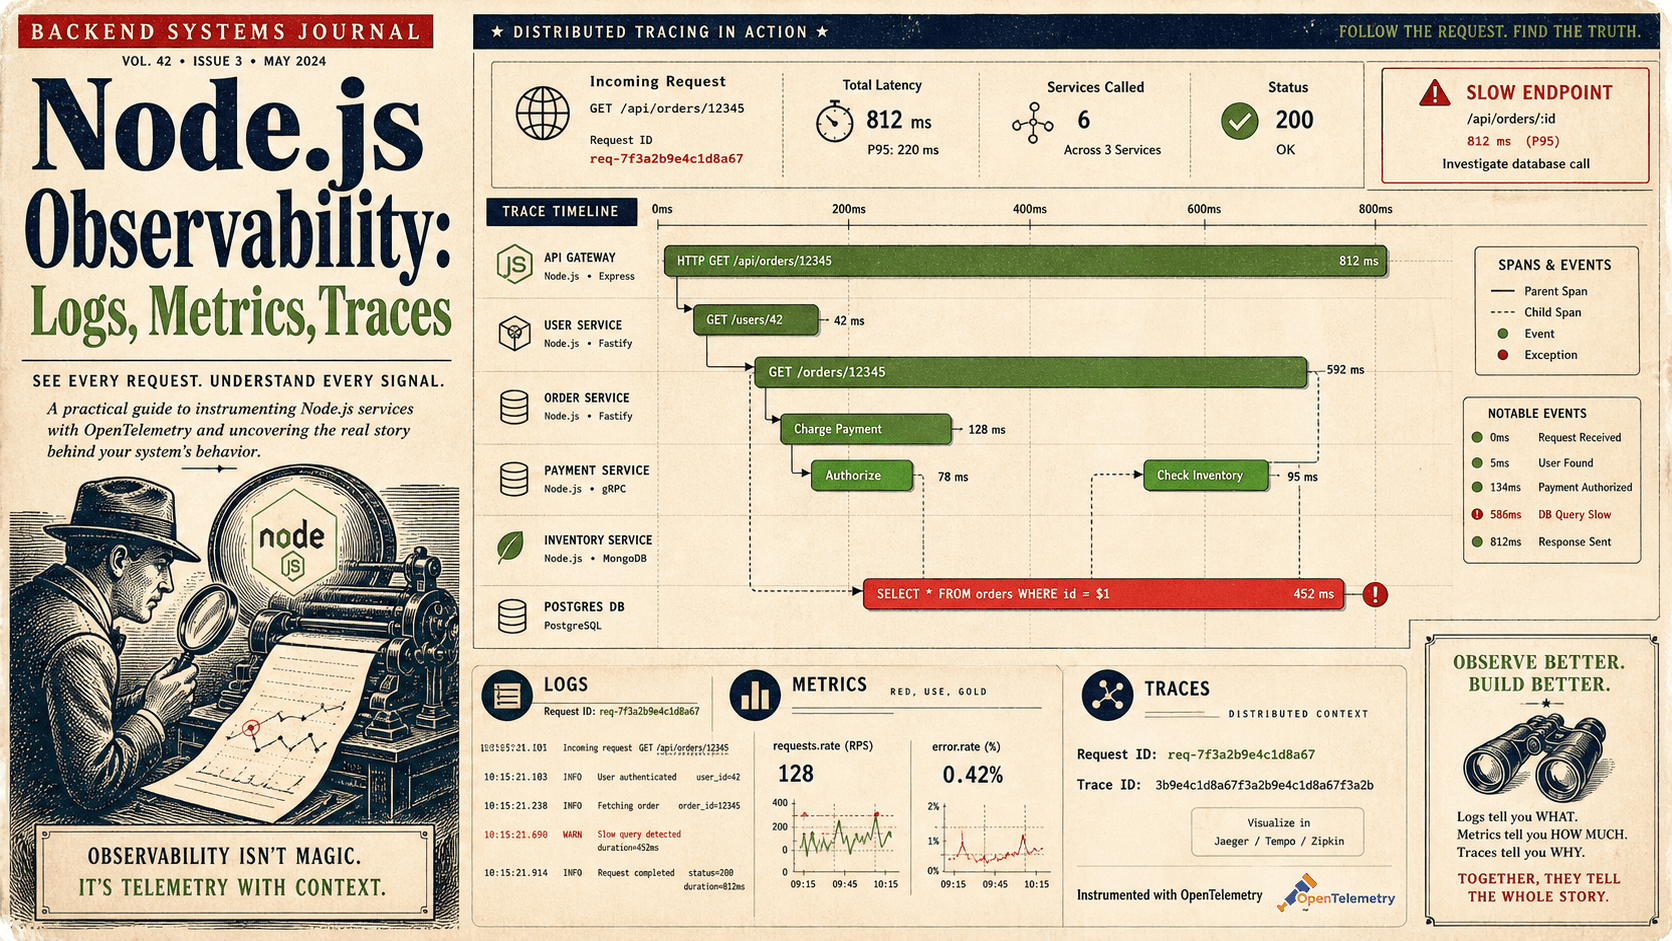
The Bridge To OpenTelemetry
Logs are one of three signals in observability — the others are metrics and traces. The big change in modern Node services is that all three connect through one identifier: the traceId.
If you set up the OpenTelemetry Node SDK (@opentelemetry/sdk-node plus an HTTP / Express instrumentation), every request gets a traceId and spanId you can attach to your logs:
import { trace } from '@opentelemetry/api';

app.use((req, res, next) => {
  const span = trace.getActiveSpan();
  const ctx  = span?.spanContext();
  req.log = logger.child({
    requestId: req.id,
    traceId: ctx?.traceId,
    spanId: ctx?.spanId,
  });
  next();
});
Now a log line in your aggregator and a trace in your tracing backend share an ID. Click a slow trace, see every log it produced. That's the moment "logging" becomes "observability." You don't need this on day one — but the pino-first setup gives it to you on day ninety with a small, additive change instead of a rewrite.
A One-Sentence Mental Model
Treat logs as small JSON events with a stable schema, a request ID, and a level that means something — and your future self will thank you the first time an alert points to one user's full story instead of a haystack.