"It Was Slow For Three Hours And We Don't Know Why"
You wake up to a Slack message: "Checkout was slow this morning, 9:14 to 12:30, mostly fine now." You open the dashboard. Average latency was high. You open the logs. There are 4 million of them. You open the traces. There are no traces.
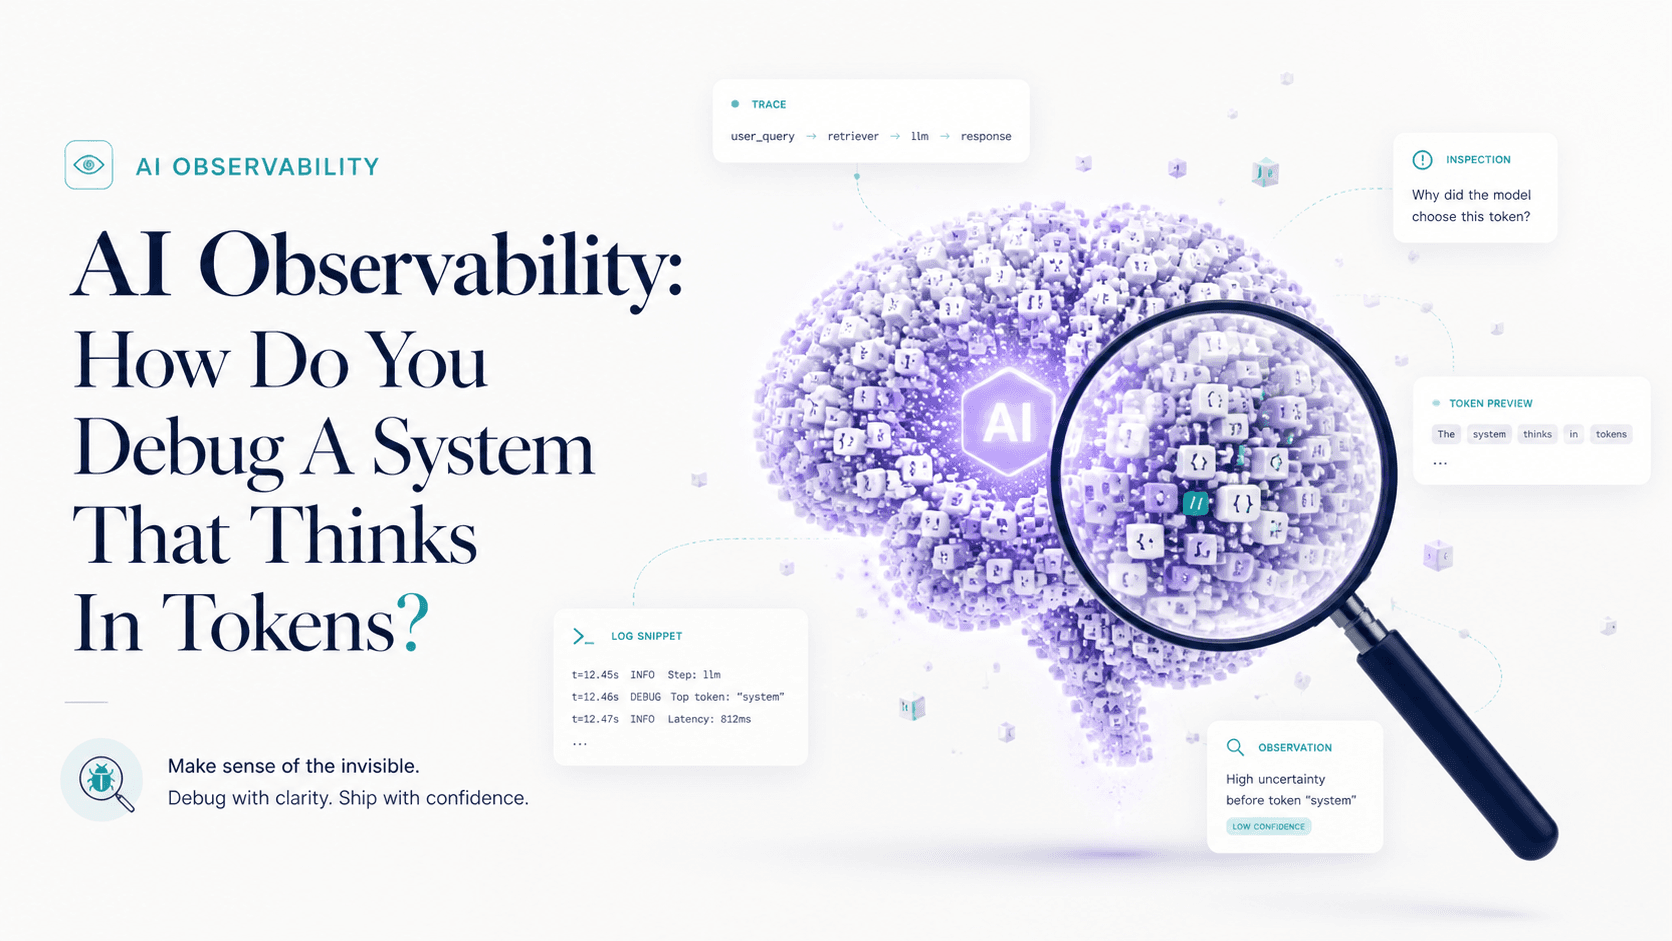
That moment — the one where you have data and no answers — is the entire reason observability exists. Not as a buzzword, not as a vendor pitch, but as the difference between knowing what happened and guessing.
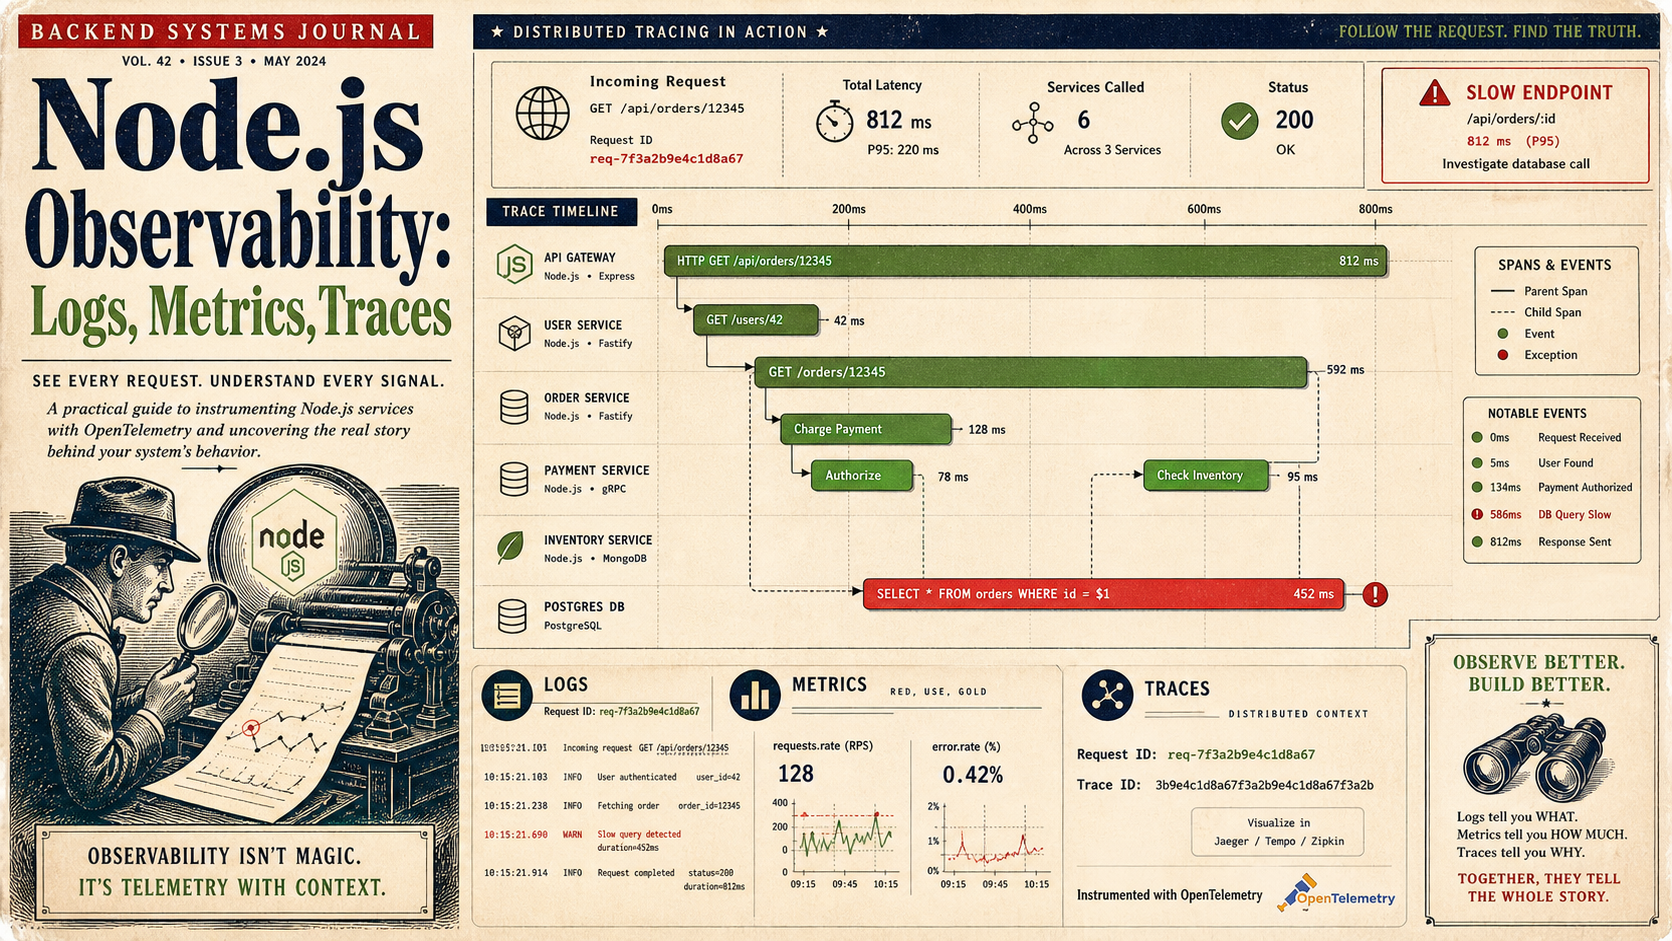
Three signals carry the load: logs say what happened, metrics say how often and how much, traces say where the time went. Each is incomplete on its own. Together, they make production debuggable.
Logs: Structured, Or You'll Regret It
Stop logging strings. Start logging objects. The cheapest single upgrade you can make to a Node.js service is replacing console.log with pino and emitting one JSON line per event.
import pino from 'pino';

export const logger = pino({
  level: process.env.LOG_LEVEL ?? 'info',
  base: {
    service: 'checkout-api',
    env: process.env.NODE_ENV,
    version: process.env.APP_VERSION,
  },
  redact: ['req.headers.authorization', 'req.headers.cookie', '*.password'],
});
Then in a request handler:
logger.info(
  {
    requestId: req.id,
    userId: req.user?.id,
    tenantId: req.tenant?.id,
    route: 'POST /checkout',
    durationMs: Date.now() - start,
    status: res.statusCode,
  },
  'checkout completed',
);
Pino is fast (it's the dominant choice for a reason), JSON is grep-friendly, and redact keeps you out of compliance trouble. In dev, pipe through pino-pretty for human eyes.
A good log line answers four questions: who (user/tenant), what (operation), how long (duration), what happened (status, error class). If your logs don't include those, your future self at 2 a.m. is going to be sad.
Metrics: The RED Method For Sanity
Logs tell you about events. Metrics tell you about rates. The trick is picking the right ones, not building a dashboard with 200 panels nobody reads.
The RED method — Rate, Errors, Duration — covers 80% of HTTP service alerting:
import express from 'express';
import client from 'prom-client';

client.collectDefaultMetrics();

const httpDuration = new client.Histogram({
  name: 'http_request_duration_seconds',
  help: 'HTTP request duration in seconds',
  labelNames: ['method', 'route', 'status'],
  buckets: [0.005, 0.01, 0.05, 0.1, 0.25, 0.5, 1, 2, 5],
});

export function metricsMiddleware(req, res, next) {
  const end = httpDuration.startTimer();
  res.on('finish', () => {
    end({
      method: req.method,
      route: req.route?.path ?? 'unknown',
      status: res.statusCode,
    });
  });
  next();
}

const app = express();
app.use(metricsMiddleware);
app.get('/metrics', async (_req, res) => {
  res.set('Content-Type', client.register.contentType);
  res.end(await client.register.metrics());
});
A histogram with sensible buckets gives you Rate (rate(http_request_duration_seconds_count[5m])), Errors (status="5xx" slice), and Duration percentiles all from one metric. Add four or five domain metrics on top — orders placed per minute, queue depth, cache hit ratio — and you have a real dashboard.
Watch out for label cardinality. route should be the parameterized path (/users/:id), not the literal URL (/users/42). Otherwise Prometheus will store one time series per user and your storage bill will get… interesting.

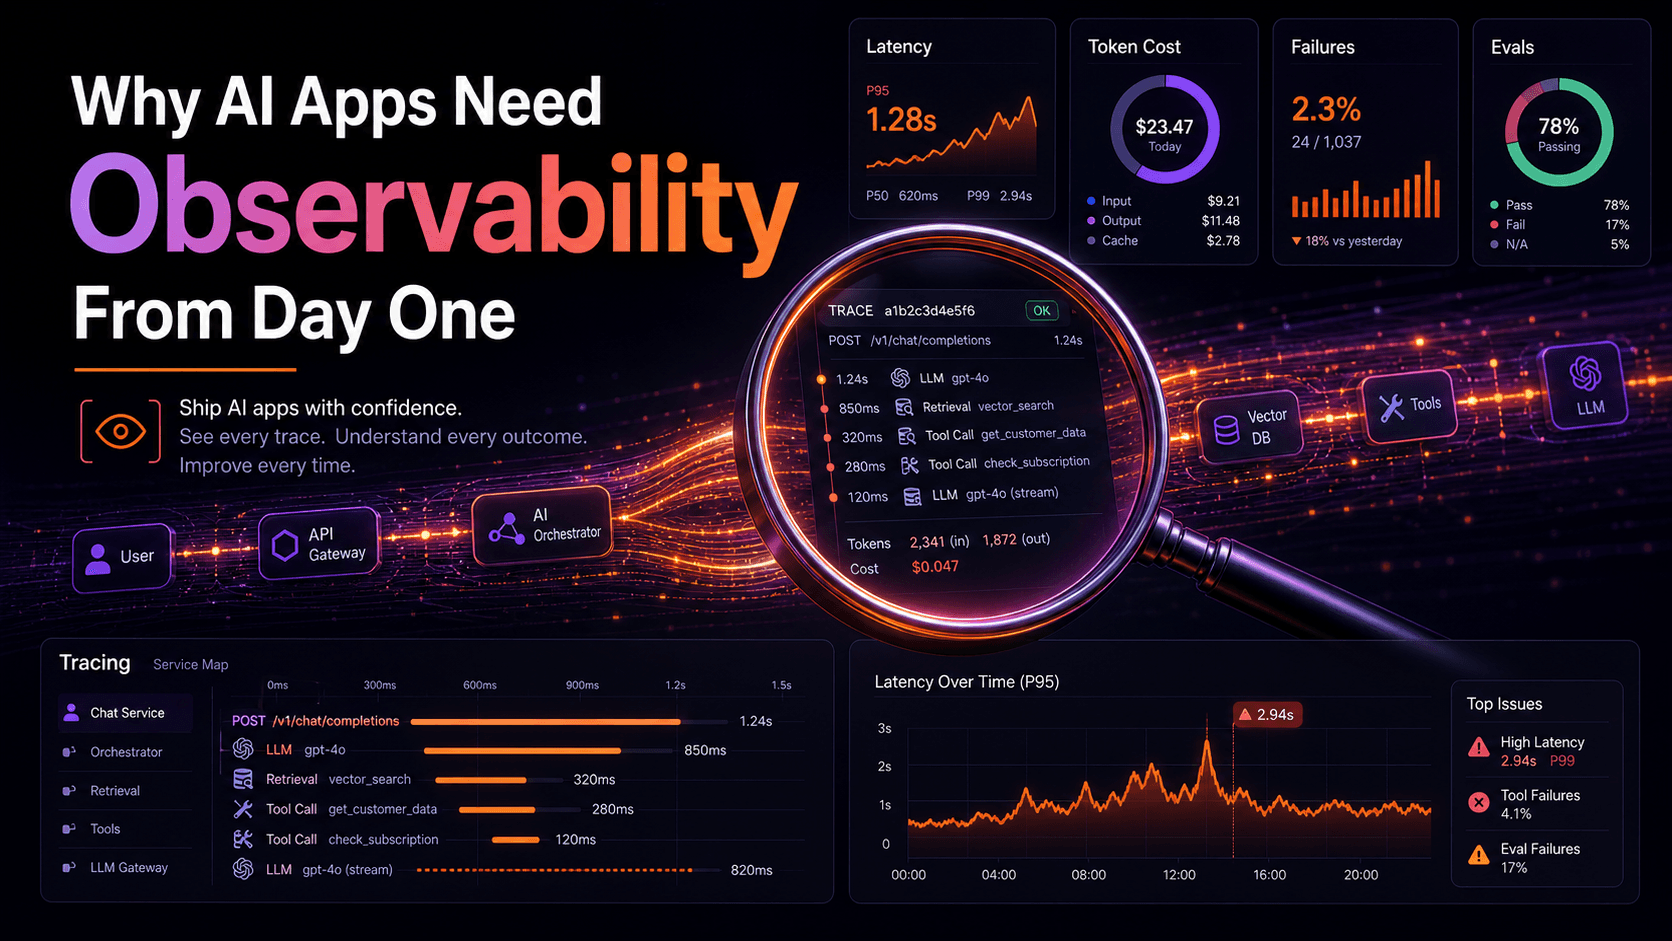
Traces: Where Did The Time Go?
Logs and metrics tell you a slow request happened. Traces tell you which span of the request was slow. For anything microservice-shaped, this is the only signal that scales with system complexity.
OpenTelemetry is the standard. The Node SDK auto-instruments most of what you'd want — HTTP, Express, Fastify, Postgres, Prisma, ioredis — once you initialize it.
// tracing.ts — load this BEFORE any other module
import { NodeSDK } from '@opentelemetry/sdk-node';
import { getNodeAutoInstrumentations } from '@opentelemetry/auto-instrumentations-node';
import { OTLPTraceExporter } from '@opentelemetry/exporter-trace-otlp-http';
import { resourceFromAttributes } from '@opentelemetry/resources';
import {
  ATTR_SERVICE_NAME,
  ATTR_SERVICE_VERSION,
} from '@opentelemetry/semantic-conventions';

const sdk = new NodeSDK({
  resource: resourceFromAttributes({
    [ATTR_SERVICE_NAME]: 'checkout-api',
    [ATTR_SERVICE_VERSION]: process.env.APP_VERSION ?? 'dev',
  }),
  traceExporter: new OTLPTraceExporter({
    url: process.env.OTEL_EXPORTER_OTLP_ENDPOINT,
  }),
  instrumentations: [getNodeAutoInstrumentations()],
});

sdk.start();
Run it via node --import ./tracing.js dist/index.js (or --require for CJS) so the auto-instrumentation patches modules before your app loads them. Then every HTTP request becomes a span tree: route handler → DB query → cache lookup → downstream HTTP call, each with its own duration.
Tracing context propagates between services via the W3C traceparent header. The auto-instrumentations attach it on outgoing requests and read it on incoming ones, which means a slow checkout shows you exactly which downstream service ate the time.
Correlation IDs: The Glue
A trace ID without it appearing in your logs is a missed opportunity. Stitch them together by injecting the active trace context into every log line:
import { trace, context } from '@opentelemetry/api';

export function withTraceContext(obj: object) {
  const span = trace.getSpan(context.active());
  if (!span) return obj;
  const { traceId, spanId } = span.spanContext();
  return { ...obj, traceId, spanId };
}

logger.info(withTraceContext({ requestId, userId, route: 'POST /checkout' }), 'checkout completed');
Now when a customer support ticket says "request ID abc-123 was broken," you can find the log line, jump to the trace ID, see the full distributed call chain, and identify the slow span. Six hours of debugging becomes thirty minutes.
The same trick works in reverse: in your tracing UI, set log links so each span deep-links to the matching log query. Most modern backends (SigNoz, Datadog, Honeycomb, Grafana Tempo + Loki) support this with a few lines of config.
Where Do You Send All This Stuff?
The pipeline is roughly the same everywhere:
- Logs. Pino writes JSON to stdout → container runtime ships it to Loki, CloudWatch, Datadog, SigNoz, or whatever else parses JSON. Don't write your own log shipper.
- Metrics.
/metricsendpoint scraped by Prometheus, or push via OTLP to a vendor. Grafana renders dashboards on top. - Traces. OTLP exporter to an OTel Collector → fanout to your tracing backend. The Collector is the right central place to add tail sampling, redaction, and routing.
The OpenTelemetry Collector is the unsung hero here. Run it as a sidecar or daemonset, point your services at the Collector, and switch backends without touching application code.
Sampling, Or Your Bill Will Hurt
Tracing every request at 1000 RPS gets expensive fast. Two strategies:
- Head sampling. Decide at the start of the trace whether to record it. Simple, cheap, blind to whether the request was interesting.
- Tail sampling. Record everything in the Collector, then keep only the slow ones, the errored ones, and a small percentage of the rest. More expensive at the Collector, much smarter.
Tail sampling in the OTel Collector is what you want once volume picks up. Until then, a 5–10% head sample with "always sample errors" gets you most of the value.
A One-Sentence Mental Model
Logs answer what happened, metrics answer how often and how much, traces answer where the time went — wire all three to one correlation ID and you turn a midnight outage into a Slack thread instead of a postmortem with tears.