You ship a Node.js service that talks to an LLM. It works on your laptop. It works in staging. You deploy it on a Tuesday and on Thursday a customer pings support with a screenshot that makes no sense, the assistant told them their invoice was due in February when it's clearly May, then offered to refund a charge that never existed.
You open the logs. You see a 200, a latency of 4.1 seconds, and a JSON blob with a prompt field and a completion field, both truncated at 500 characters because someone was worried about log volume. You can't tell which version of the system prompt was used, you can't tell what tools the model called, you can't tell what it spent on tokens, and you can't tell whether this is the first time it has gone off the rails or the four-hundredth.
That gap, between "the request succeeded" and "I can explain what actually happened", is the gap that AI observability is trying to close. And it doesn't look like the observability you already have for your REST API. The signals are different, the failure modes are different, and the off-the-shelf APM tool that's been watching your event loop for the past five years is mostly blind to it.
This piece is about what you actually need to instrument in a Node.js AI system, and how to wire it up without bolting on a second observability stack. We'll go through the four signals that matter most: prompt traces, token costs, output quality (the hallucination problem), and tool-call failures. By the end you should have a mental model of what a healthy AI service looks like on a dashboard, and a working idea of how to get there from where you are.
Let's break it down.
Why your existing APM is not enough
You probably already have metrics on your Node service. Request rate, latency p50/p95/p99, error rate, event loop lag, heap size, the usual. None of that is wrong. It's just measuring the wrong layer for what AI systems do.
A traditional API call is deterministic. Same input, same output, same code path. When latency spikes, you look at downstream dependencies. When errors spike, you look at exceptions and 5xx codes. The model you carry in your head is "the service did the work it was supposed to do, slower or with errors."
An AI call is the opposite of deterministic. Same input, different output. The work itself is fuzzy. A successful HTTP 200 doesn't tell you whether the answer was correct, whether the model picked the right tool, whether it made up a field name, or whether the customer is going to come back tomorrow and ask why their refund never showed up. The model in your head has to change to "the service ran, but did it do the right thing, and how much did that cost?"
That's why AI observability adds new signals on top of the ones you already have:
- The full content of the prompt that was sent and the completion that came back, not just summary fields.
- The token counts and costs broken down by feature, user, or experiment.
- A way to score whether the output was actually good, not just whether the request succeeded.
- The chain of tool calls the model made, with timings and failures, the same way you'd trace a service mesh.
These aren't extras. If you don't have them, you're flying with one eye closed.
The shape of an AI trace
Before we get into each signal, it helps to look at the unit they all hang off of: the trace.
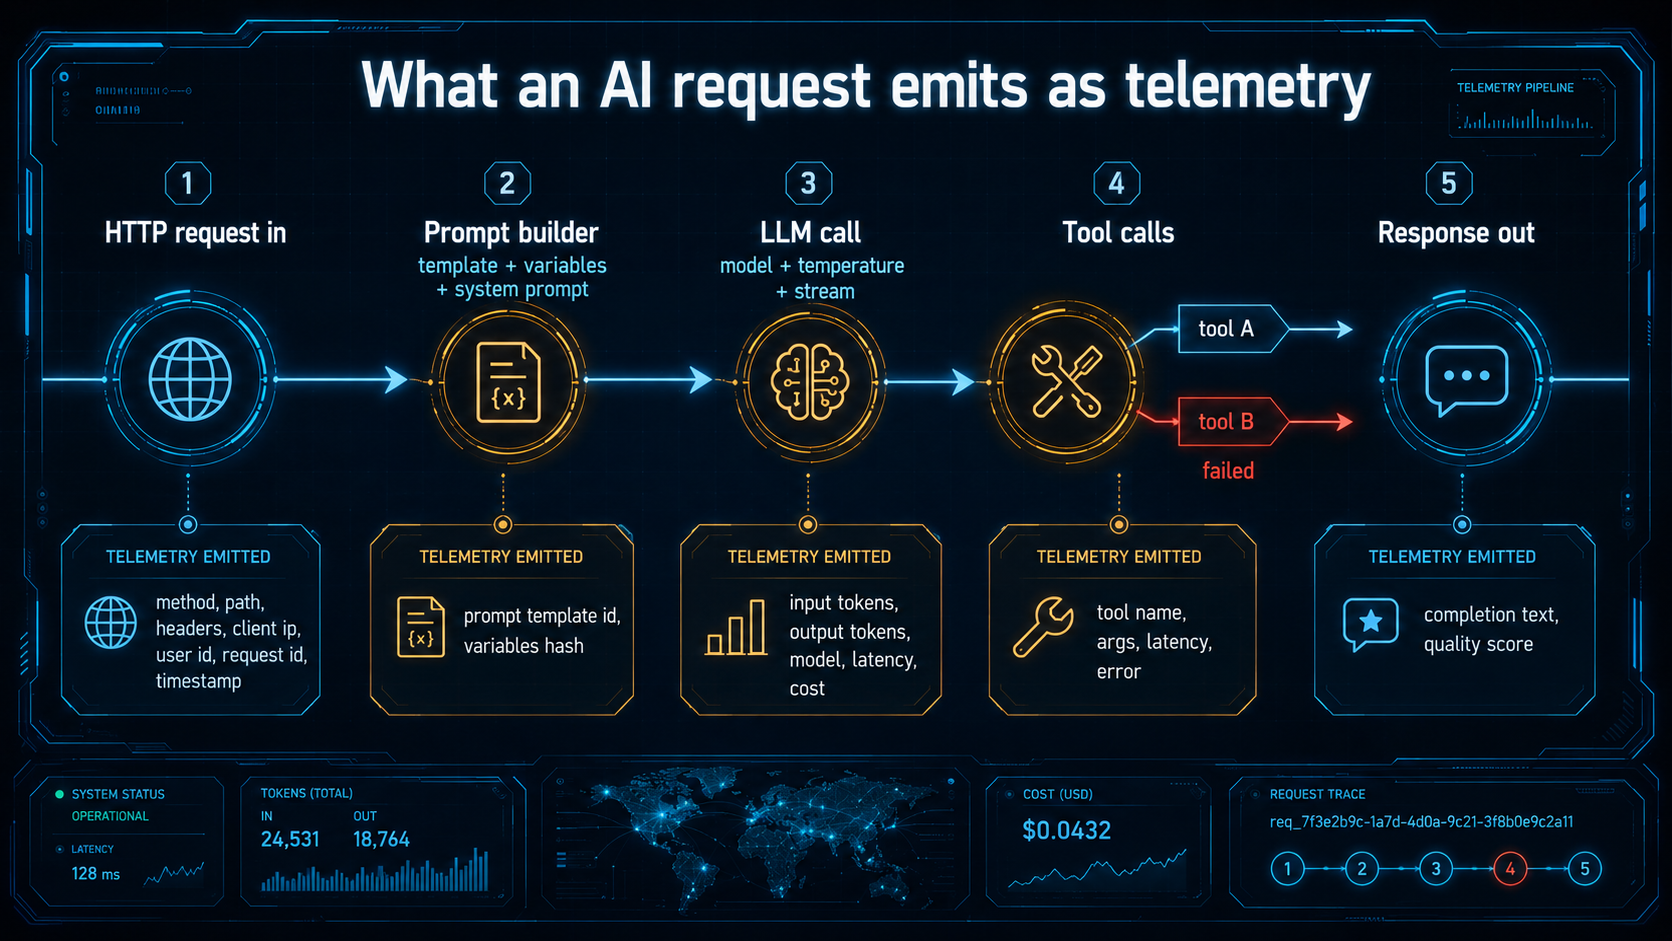
A request to an AI feature in Node.js usually does more than one thing. A typical flow looks like this:
- The HTTP handler receives a user message.
- It assembles a system prompt and user prompt from templates and stored context.
- It calls the LLM (sometimes streaming, sometimes not).
- The model may call back to your code with one or more tool calls.
- Each tool runs (database queries, vector searches, third-party APIs).
- The model gets the tool results, generates the final answer.
- The handler returns to the user.
In trace terms, that's one root span (the HTTP request) with a nested LLM span, with nested tool spans, sometimes with multiple LLM spans because the model called itself again with tool results. The structure is the same idea as tracing a microservice fan-out, it's just that the "service" you're calling is a stochastic black box that may decide to call your tools two or three times before it commits.
If you've used OpenTelemetry, the good news is the working group has been writing semantic conventions for GenAI, specific span names, attributes for gen_ai.system, gen_ai.request.model, gen_ai.usage.input_tokens, gen_ai.usage.output_tokens, and so on. The bad news is the conventions are still evolving as of this writing, so different SDKs will give you slightly different attribute names. Pick one and stick to it; whatever you wire up today will still be roughly correct a year from now.
In Node specifically, the OpenTelemetry SDK plus auto-instrumentation for HTTP, Express/Fastify, and your DB driver gets you the baseline. The AI-specific spans you'll add yourself or get from a wrapper SDK.
A minimal manual instrumentation around an OpenAI call looks like this:
import OpenAI from "openai";
import { trace, SpanStatusCode } from "@opentelemetry/api";

const tracer = trace.getTracer("ai-app");
const openai = new OpenAI();

export async function chat(messages: { role: string; content: string }[]) {
  return tracer.startActiveSpan("gen_ai.chat", async (span) => {
    span.setAttribute("gen_ai.system", "openai");
    span.setAttribute("gen_ai.request.model", "gpt-4o-mini");
    span.setAttribute("gen_ai.request.messages_count", messages.length);

    try {
      const res = await openai.chat.completions.create({
        model: "gpt-4o-mini",
        messages,
      });

      span.setAttribute("gen_ai.usage.input_tokens", res.usage?.prompt_tokens ?? 0);
      span.setAttribute("gen_ai.usage.output_tokens", res.usage?.completion_tokens ?? 0);
      span.setAttribute("gen_ai.response.finish_reason", res.choices[0]?.finish_reason ?? "");

      return res.choices[0]?.message?.content ?? "";
    } catch (err: any) {
      span.recordException(err);
      span.setStatus({ code: SpanStatusCode.ERROR, message: String(err) });
      throw err;
    } finally {
      span.end();
    }
  });
}
You don't have to write this for every call yourself. Wrappers like the Vercel AI SDK's telemetry options, OpenLLMetry's Node SDK, LangFuse's Node client, and the Anthropic and OpenAI SDKs themselves have been adding tracing hooks. But it's useful to see what they're actually doing under the hood, they're starting a span, decorating it with gen_ai.* attributes, recording the latency and token usage, and ending the span. That's it. The rest is dashboards.
Prompt tracing: see what the model saw
The single most useful piece of AI telemetry is also the most obvious one: capture the prompt and the response, in full, on every call.
This sounds trivial until you try it. Prompts are big, a system prompt with embedded RAG context, plus a few rounds of chat history, plus tool definitions can easily run 8KB. Multiply that by a few thousand calls a day, log it the same way you log your HTTP requests, and you've just blown out your log retention budget.
The way out is to treat prompts as their own data, not as request logs:
- Store them in something that can hold blobs cheaply, object storage or a dedicated trace store, not your hot log index.
- Hash and reference, don't re-log. The system prompt rarely changes; the user message and a few variables are what's actually new per request.
- Sample for replay, retain everything for debugging the last 24-72 hours, downsample beyond that.
A simple pattern is to attach the prompt id to the span and store the body separately:
import { createHash } from "node:crypto";

export interface PromptCapture {
  templateId: string;
  templateVersion: string;
  variables: Record<string, unknown>;
  finalPrompt: string;
}

export function capturePrompt(p: PromptCapture) {
  const hash = createHash("sha256")
    .update(p.templateId + p.templateVersion + JSON.stringify(p.variables))
    .digest("hex")
    .slice(0, 16);

  // Write to your blob store / trace store, async, fire-and-forget.
  void writePromptBlob(hash, p);

  return hash;
}
Then on the span you set prompt.template_id, prompt.template_version, and prompt.hash. When something looks weird in production, you click the trace, follow the hash, and read the exact prompt that went out. The trace doesn't carry the 8KB; the trace store does, and only the ones you actually look at get fetched.
Two details worth getting right while you're at it.
Version your prompt templates. This is the single most important thing you can do for your future debugging self. When a prompt is a string literal in your code, the only version pointer you have is the git commit, and you have to map "this trace happened at 14:32 on May 14" to "what was the prompt at that commit on that day across all services". Instead, give every prompt template a stable id and a version number, and store them somewhere queryable, a database table, a config file, a prompt management product. When you change a prompt, bump the version. Every trace records which version it used. Now you can answer "are hallucinations worse since we shipped v7?" in a query, not in a half-day spelunking session.
Capture the streaming output too. If you're using streaming completions (and most user-facing apps should), the response object you get at the end of the stream often has the full assembled text, but you have to accumulate it deliberately. Don't lose it just because you finished sending tokens to the client.
let full = "";
for await (const chunk of stream) {
  const delta = chunk.choices[0]?.delta?.content;
  if (delta) {
    full += delta;
    yield delta;
  }
}
span.setAttribute("gen_ai.response.text_length", full.length);
await writeCompletionBlob(span.spanContext().traceId, full);
When a user complains about a specific weird answer, you want to be able to pull up the exact answer they saw, character for character. Logging "the model returned 412 characters" is not the same as logging the 412 characters.
Token costs: turn the bill into a metric
If prompts are the most useful signal, token cost is the one that surprises you first.
The OpenAI and Anthropic SDKs already return usage on the response, prompt_tokens and completion_tokens (or input_tokens and output_tokens depending on the provider). That's free data, sitting on every response, and most teams ignore it until the monthly invoice arrives. Don't.
Wire it onto your traces and onto a metric. The trace tells you which request used how many tokens. The metric tells you the rate, broken down by whatever dimensions you care about, feature, model, user tier, experiment arm.
import { metrics } from "@opentelemetry/api";

const meter = metrics.getMeter("ai-app");
const inputTokens = meter.createCounter("gen_ai.usage.input_tokens");
const outputTokens = meter.createCounter("gen_ai.usage.output_tokens");
const costUsd = meter.createCounter("gen_ai.cost.usd");

const PRICING: Record<string, { in: number; out: number }> = {
  "gpt-4o-mini": { in: 0.15 / 1_000_000, out: 0.60 / 1_000_000 },
  "claude-sonnet-4-6": { in: 3 / 1_000_000, out: 15 / 1_000_000 },
  // ... fill in the rest from the provider's pricing page, update on a schedule
};

export function recordUsage(model: string, usage: { input: number; output: number }, feature: string) {
  const labels = { model, feature };
  inputTokens.add(usage.input, labels);
  outputTokens.add(usage.output, labels);

  const price = PRICING[model];
  if (price) {
    const dollars = usage.input * price.in + usage.output * price.out;
    costUsd.add(dollars, labels);
  }
}
That's it. A counter on input tokens, a counter on output tokens, a derived counter on dollars. A line chart on each of those, split by feature, will tell you within an hour of shipping whether the feature you just released is a small bump or a budget event.
A few habits that pay off:
Tag every call with a feature label. Don't lump all your LLM calls into a single gen_ai.cost.usd bucket, split by feature (chat, summary, classify, embed, agent_step) at the very least. When the bill spikes, the only useful question is "which feature?", and you can't ask it if you didn't label.
Watch input tokens more carefully than output tokens. Input is where the unexpected costs live. Output tokens are usually capped by your max_tokens setting and by the model itself. Input tokens, on the other hand, are determined by your prompt building logic, RAG context that grows over time, chat histories that you forgot to truncate, tool definitions that ballooned when someone added 30 new tools. A small bug in your RAG retriever, pulling 20 documents instead of 5, can quadruple your input bill overnight, and the only way you'll know is a token-count chart.
Set a cost ceiling per request. Estimate the cost of a request before you make it: tiktoken counts tokens client-side for OpenAI, and for Anthropic the API's count_tokens endpoint is the right call (the older @anthropic-ai/tokenizer npm package exists but is no longer accurate for current Claude models). Reject obviously runaway requests at the door. A user pasting a 200KB log into your chat should hit a clean 413 from your code, not a 30-second LLM call followed by a refund email.
Budget alerts, not just monitoring. A graph nobody looks at doesn't catch the 4am cost incident. Wire the dollar counter into an alert that fires when daily spend exceeds some threshold, flat dollar amount, or percentage above a 7-day baseline. The alert should hit on-call, not just email. Cost is a real reliability signal in AI systems, the same way error rate is in everything else.
Hallucination monitoring: the part nobody likes
Here's the awkward truth: a successful HTTP 200 from your AI service tells you almost nothing about whether the answer was correct. You can have a service with 100% uptime, sub-second p99 latency, perfect token accounting, and a third of the answers are wrong in subtle ways nobody is noticing.
This is the part of AI observability that doesn't map cleanly onto traditional monitoring. You're not measuring "did the request succeed", you're measuring "was the output good." That's a quality signal, and quality is hard to measure cheaply.
There are roughly three tiers of effort, and you usually want a mix of all three running in production.
Tier 1: structural checks on the output. If you ask the model to return JSON matching a schema, validate it. If you ask for a list of citations, check that each citation actually exists in the source documents you retrieved. If you ask for a SQL query, parse it and check it only references tables your user has access to. These are deterministic. They run on every request. They catch a surprising amount of nonsense, malformed JSON, made-up table names, citations to documents that don't exist, for almost no cost.
import { z } from "zod";

const RefundResponse = z.object({
  refund_id: z.string().uuid(),
  amount_cents: z.number().int().positive(),
  reason: z.string().max(200),
});

export function parseRefund(raw: string, retrievedDocs: { id: string }[]) {
  const parsed = RefundResponse.safeParse(JSON.parse(raw));
  if (!parsed.success) {
    return { ok: false, error: "schema_mismatch", issues: parsed.error.issues };
  }
  if (!retrievedDocs.some((d) => d.id === parsed.data.refund_id)) {
    return { ok: false, error: "hallucinated_refund_id", value: parsed.data.refund_id };
  }
  return { ok: true, value: parsed.data };
}
Push the ok value through to a metric, gen_ai.output.valid as a counter, and now you have a real-time signal on how often your model is producing garbage. If it suddenly drops from 99% to 84%, something has changed: a prompt version, a model version, the upstream provider's behavior. You'll see it before customers do.
Tier 2: model-graded evals on a sample. For things that can't be checked structurally, "is this customer service reply polite", "does this summary cover the key points", "did the assistant follow our refusal policy", you can use another (usually cheaper) model to judge a sample of production traffic. This is sometimes called "LLM as a judge" or "model-graded eval".
The rough pattern: pick 1-5% of completions, send them along with the original prompt to a judge model with a rubric ("rate the helpfulness from 1 to 5 and explain"), record the score as a metric. Done well, this gives you a continuous quality signal that you can chart over time and alert on. Done badly, vague rubric, the judge is the same model as the actor, no calibration against human labels, it gives you a metric that looks like a signal and isn't.
A few practical notes from people who have done this: keep the judge prompt short and the rubric specific; calibrate by having humans label 100 examples and checking that the judge agrees with them; run the judge async (it's not on the user's critical path); cache by completion hash so you're not paying twice if a customer retries the same query.
Tier 3: golden datasets and offline evals. None of the above replaces having a curated dataset of inputs and expected outputs that you run every prompt change against in CI. Golden datasets are how you catch regressions before they ship, model upgrade, prompt edit, RAG retriever change. The dataset is hard to build the first time (you need real-looking examples with vetted answers), but it pays off forever after. Stage your evals: smoke tests on every PR, full evals nightly or on release, A/B comparisons when you're changing a prompt.
The observability piece, specifically: emit a metric for golden eval pass rate every time the suite runs, store it as a time series. Now your dashboard has a "quality over time" line alongside latency and cost. When that line dips, you have a release to investigate.
Tool call failures: the agent problem
If your AI system uses tools, and most non-trivial ones do, your observability problem isn't just "did the model give a good answer", it's "did the agent execute the right sequence of steps without falling over." That's much closer to tracing a microservice, and the failure modes look familiar in shape but unfamiliar in cause.
A typical agent loop is: the model decides to call a tool, your code runs the tool, the model gets the result, the model decides what to do next (call another tool, finish, ask the user). Each of those steps can break in its own way:
- The model emits a tool call with malformed arguments (missing a required field, wrong type).
- The tool itself fails (DB timeout, third-party 500, validation rejection).
- The tool returns successfully but with results the model misinterprets.
- The model decides to call the same tool with the same arguments three times in a row, ignoring the result.
- The agent hits a max-step limit and gives up halfway through.
Each of those wants its own metric and its own attribute on the span.
import { trace, SpanStatusCode } from "@opentelemetry/api";

const tracer = trace.getTracer("ai-app");

export async function runTool(name: string, args: unknown, run: (a: any) => Promise<unknown>) {
  return tracer.startActiveSpan(`gen_ai.tool.${name}`, async (span) => {
    span.setAttribute("gen_ai.tool.name", name);
    span.setAttribute("gen_ai.tool.args_size", JSON.stringify(args).length);

    const start = Date.now();
    try {
      const result = await run(args);
      span.setAttribute("gen_ai.tool.outcome", "success");
      span.setAttribute("gen_ai.tool.result_size", JSON.stringify(result).length);
      return result;
    } catch (err: any) {
      span.recordException(err);
      span.setAttribute("gen_ai.tool.outcome", "error");
      span.setAttribute("gen_ai.tool.error_class", err?.name ?? "Error");
      span.setStatus({ code: SpanStatusCode.ERROR, message: String(err) });
      throw err;
    } finally {
      span.setAttribute("gen_ai.tool.latency_ms", Date.now() - start);
      span.end();
    }
  });
}
Then a couple of derived metrics fall out naturally:
- Tool error rate per tool name (which tools fail most often).
- Tool p95 latency per tool name (which tools are slow enough to break the user experience).
- Tool call count per request (how many steps an agent is taking, a creeping number here is a sign your agent is getting confused).
- Schema validation failure rate (the model is producing malformed tool calls, a regression in the model or a bug in your tool descriptions).
A couple of patterns I've found genuinely useful:
Treat schema validation failures as a separate category. When the model emits {"date": "yesterday"} for a tool that expects an ISO date, that's not a tool error, the tool never ran. It's a model error, and you want to track it separately so you can spot when a prompt edit broke your schema discipline.
Log the agent's reasoning trace when steps > N. Agents that keep looping past 5 or 10 steps are usually stuck. Capture the full sequence of tool calls and the model's intermediate reasoning when this happens, and aggregate by failure shape. You'll find clusters, "it keeps trying to search when it should be asking the user", "it calls the same DB query twice because it didn't understand the result format", and each cluster becomes a prompt-engineering fix.
Set a step limit and emit a metric when you hit it. If your agent can run up to 15 steps and you have a metric tracking how often it hits the ceiling, that's a usefully cheap signal for "the agent is failing in a way that doesn't throw."
Picking a stack without falling into a hole
So you have prompts, costs, quality, and tool spans. Where does all of it actually go?
The honest answer is "it depends on what you already have." Three patterns are common:
The first is the all-in-one AI observability product, LangFuse, Helicone, LangSmith, Phoenix from Arize, the various OpenLLMetry-derived hosted offerings. These are built specifically for this problem. You wire up their SDK around your LLM calls and you get prompts, traces, costs, evals, and dashboards out of the box. The trade-off is a separate UI from your existing observability, and pricing models that scale with traffic in ways that bite at high volume.
The second is bolting onto your existing OpenTelemetry pipeline. You emit gen_ai.* spans and metrics with whatever Node SDK you prefer, and they land in the same backend as your HTTP traces, Honeycomb, Datadog, New Relic, Grafana Cloud, whatever you already use. Traces and dashboards live together. You don't get a built-in prompt UI or a built-in eval product, but you can build them, store prompt bodies in object storage, link from trace ID. Datadog and a few others have started shipping dedicated LLM observability views on top of OTel data, which closes the gap somewhat.
The third is a hybrid: prompts and evals in a specialized product, metrics and traces in your existing APM. The two get linked by trace ID so you can click from a latency spike in Grafana to the prompt body in LangFuse. This is more wiring but lets you optimise each piece independently, your APM for latency and error budgets, your AI product for prompt versioning and quality scoring.
There's no right answer. The wrong answer is none of the above, running blind with print statements and praying.
A small reflection
The first thing I want anybody to take away from this is: AI observability is not a separate world from the observability you already have. The signals are different but the discipline is the same, measure what matters, label it well enough to slice, alert when it moves, look at the dashboard before customers do.
The second is that the cost of not instrumenting an AI system compounds in a way that's different from a normal service. A normal service that's slightly broken gives you 502s and angry users; you find out, you fix it. An AI service that's slightly broken gives you wrong answers, confident tone, happy-looking HTTP 200s, and a slow erosion of trust. By the time you notice, you have a backlog of weird support tickets and no trail to find what went wrong.
You don't have to build all of this on day one. The order I'd put on it: prompt and completion logging first (you cannot debug anything without it), token cost metrics second (the bill teaches you discipline), tool span instrumentation third (the moment you have agents), output quality monitoring fourth (it's the most work, and you'll know what to measure only after watching the other three for a while).
Wire those four signals into your existing observability stack, give yourself dashboards you actually look at, and your AI system stops being a black box you ship and hope for. That's the bar. Everything else is polish.