You've shipped a PHP service. It's been humming along for months. Then one Tuesday afternoon, a support engineer pings you: "a customer says checkout is broken, here's their email, can you tell me what happened." You SSH into the server, run tail -f on a log file, and the only thing you see is a wall of notice: PHP Deprecated... and your own error_log("got here") from three months ago.
That's the moment most PHP backends discover observability. Or rather, discover the lack of it.
The good news is PHP has a great logging story if you set it up early. The not-so-good news is error_log() and var_dump() are not that story, and most teams have to retrofit the real one under pressure. This piece is the version of "set it up before you need it": Monolog, structured JSON, correlation IDs, log levels, and where traces fit in once logs alone stop being enough.
Three Signals, One Conversation
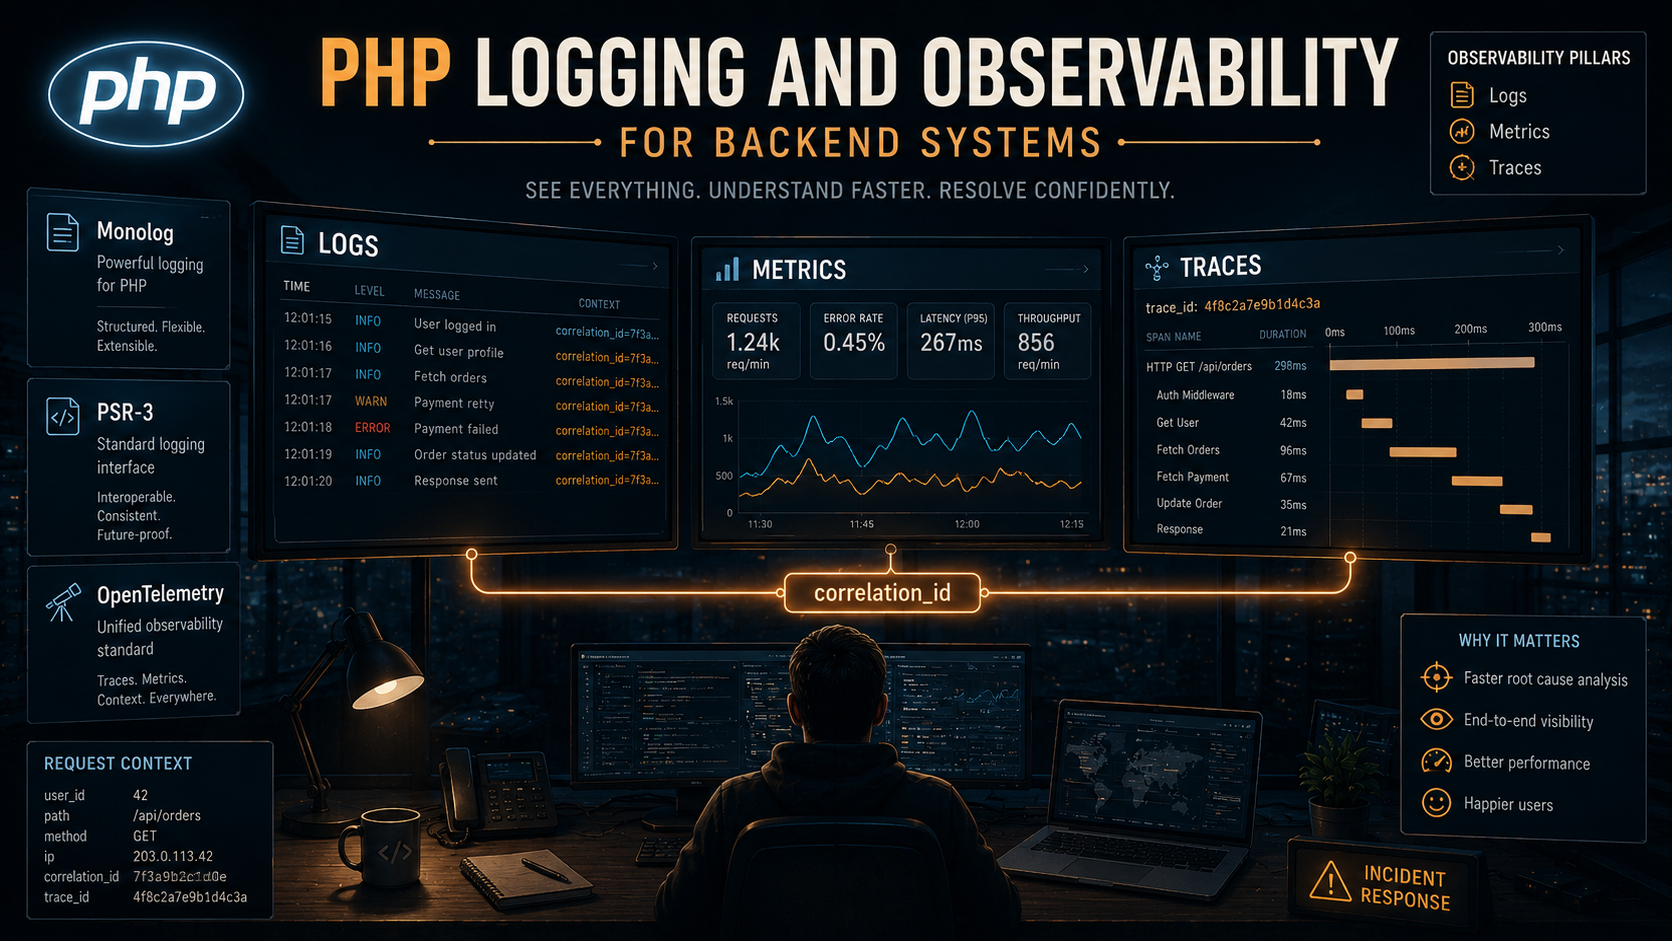
Before any code, get the mental model straight: observability is three different signals, not one.
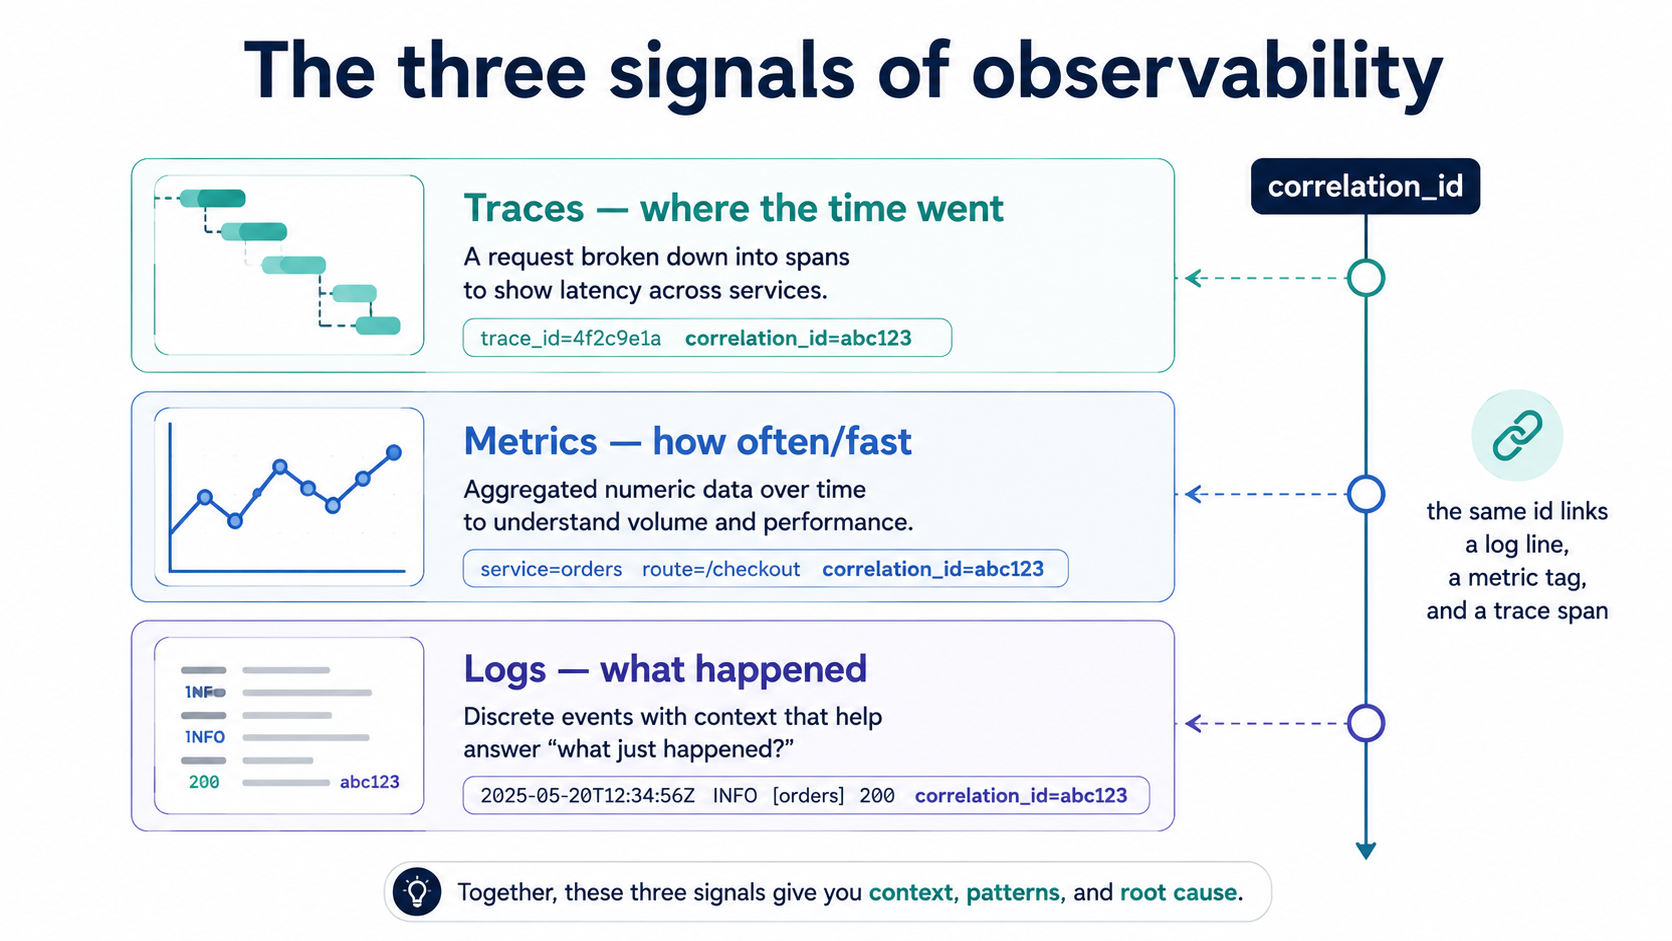
- Logs answer what happened. A discrete event with a timestamp and some context.
- Metrics answer how often, how fast, how many. Numbers you can aggregate, alert on, and chart.
- Traces answer where in the request did the time go. The path a single request took through your code, with timings on each step.
PHP teams tend to over-invest in logs because logs are easy and PHP makes them easy. But a log line says nothing about whether 10 or 10,000 customers hit the same bug, and it can't tell you that your checkout endpoint is slow because a third-party SDK is doing 14 sequential HTTP calls inside Order::place(). Logs are the floor of observability, not the ceiling.
The plan for this article is to get the floor right first, then climb.
Why error_log Stops Working
PHP ships with error_log(). It writes a string to a file (or syslog, or stderr). For a one-process script, it's fine. For anything that lives behind PHP-FPM with even a few workers, it starts hurting in three ways.
First, strings are not searchable. When your log aggregator ingests the line User 4521 failed checkout because card 4242****1234 was declined, it has to parse it back out with a regex if you ever want to filter by user. Multiply that by a thousand log shapes and you're maintaining a parser library next to your app.
Second, you have no request context. Two parallel FPM workers serving different customers write interleaved lines into the same file. There's nothing in error_log("payment failed") that tells you which request it belongs to.
Third, levels are vibes. error_log has one knob. Either it writes or it doesn't. The difference between a debug breadcrumb and a "page on-call now" event has to live in the message text, and once it lives in the message text, you can't filter on it.
Structured logging, where every log line is one JSON object and fields have names and types, fixes all three. PHP's standard library doesn't do this directly, but every framework-agnostic project standardises on the same two things: PSR-3 for the interface and Monolog for the implementation.
PSR-3 And Monolog: The Two Things Everyone Agrees On
PSR-3 is the PHP-FIG interface for loggers. It's tiny: a Psr\Log\LoggerInterface with one method per level (debug, info, notice, warning, error, critical, alert, emergency) plus a generic log($level, $message, $context). Every modern library accepts a LoggerInterface in its constructor.
Monolog is the implementation. It's installed in basically every serious PHP codebase. Laravel uses it under the hood, Symfony bundles it, Slim recommends it, and every package that takes a logger takes a LoggerInterface. You compose a Monolog logger out of three kinds of pieces:
- Handlers decide where logs go: a file, stderr, syslog, Sentry, Slack, Elasticsearch, a TCP socket.
- Formatters decide how logs look on the way out: a line of text, a JSON object, a custom shape.
- Processors decide what context gets attached to every record: request ID, user ID, memory usage, stack trace.
You can swap any of the three without changing your application code, because everywhere in your app you only ever depend on Psr\Log\LoggerInterface. That separation is what makes the rest of this piece possible.
use Monolog\Logger;
use Monolog\Handler\StreamHandler;
use Monolog\Formatter\JsonFormatter;
use Monolog\Level;

$handler = new StreamHandler('php://stdout', Level::Info);
$handler->setFormatter(new JsonFormatter());

$logger = new Logger('app');
$logger->pushHandler($handler);

$logger->info('order placed', ['order_id' => 'ord_4521', 'amount_cents' => 1999]);
That call writes one line of JSON to stdout:
{"message":"order placed","context":{"order_id":"ord_4521","amount_cents":1999},"level":200,"level_name":"INFO","channel":"app","datetime":"2026-05-16T10:14:33.512+00:00","extra":{}}That's the difference. Same call, vastly different downstream story: your aggregator stores order_id as a column, you can query order_id = "ord_4521" and find every event for that order in milliseconds, and you can build a dashboard for amount_cents > 100000 without touching application code.
Channels: Routing Different Logs To Different Places
Once you're emitting structured logs, you'll quickly want different logs to go different places. Audit events should not share a destination with debug breadcrumbs. Failed payments should page someone; an info line about a healthy heartbeat should not.
Monolog's Logger has a name, and that's the channel. You compose multiple loggers, each with its own handler stack, each labelled. Application code asks the container for the channel it wants.
$appHandler = (new StreamHandler('php://stdout', Level::Info))
    ->setFormatter(new JsonFormatter());

$auditHandler = (new StreamHandler('/var/log/myapp/audit.log', Level::Info))
    ->setFormatter(new JsonFormatter());

$app   = new Logger('app');   $app->pushHandler($appHandler);
$audit = new Logger('audit'); $audit->pushHandler($auditHandler);

$audit->info('user role changed', [
    'actor_id' => 'usr_99',
    'target_id' => 'usr_123',
    'from' => 'member',
    'to' => 'admin',
]);
A common production shape, regardless of framework:
app: general info/warning/error from request handling.audit: security-relevant events that compliance might ask about later.queue: events emitted from background jobs.external: outbound HTTP calls, especially to flaky third parties.sql: slow queries (filter by duration in a handler).
The point isn't the names. The point is that you decide the categories once, you give each one a destination and a retention policy, and you stop having to grep one giant file for the line you need.
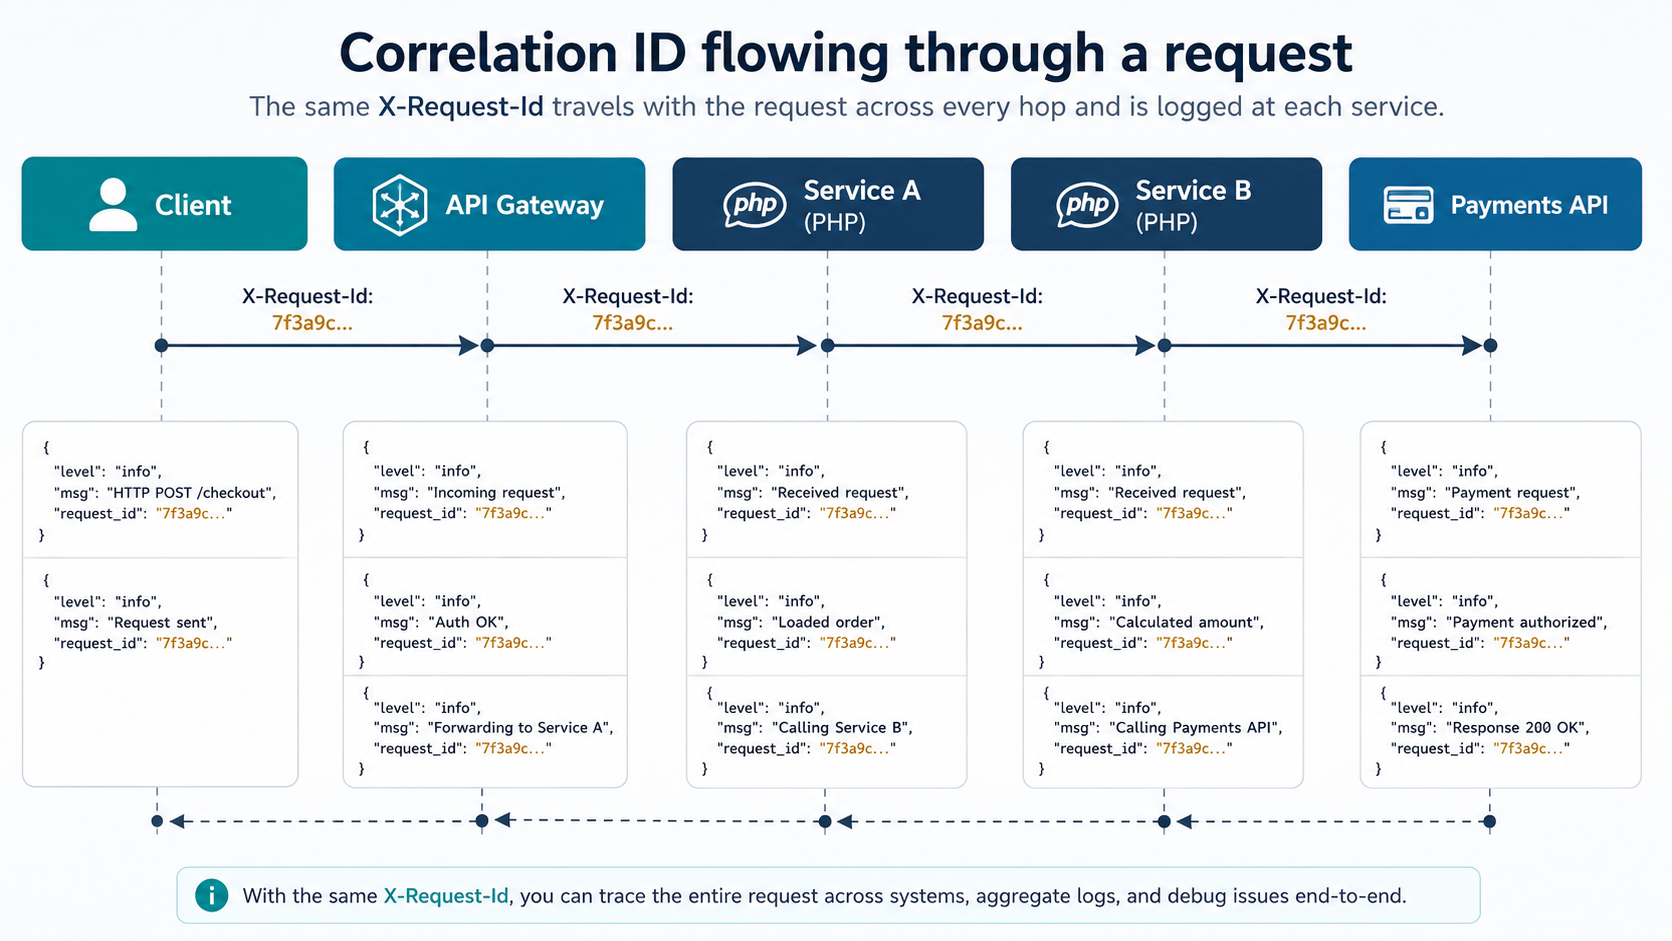
Correlation IDs: The Field That Makes Logs Useful
Structured logs let you filter by user_id or order_id. But the field you'll reach for most often is the one that means "every line that came from this one request". That's the correlation ID (also called request ID or trace ID, same idea, different prefix).
The shape is simple:
- At the very start of the request, generate (or read from an incoming header) a unique ID.
- Stuff it into a place every logger in this process can see.
- Attach it to every log line emitted for the rest of the request.
- Send it back in the response as a header so clients can include it when reporting bugs.
In PHP-land that "place every logger can see" is usually a Monolog processor, a callable that mutates every record before it's emitted.
use Monolog\LogRecord;
use Monolog\Processor\ProcessorInterface;

final class RequestContextProcessor implements ProcessorInterface
{
    public function __construct(private readonly string $requestId) {}

    public function __invoke(LogRecord $record): LogRecord
    {
        $record->extra['request_id'] = $this->requestId;
        return $record;
    }
}
Wired up in a tiny front-controller middleware:
$requestId = $_SERVER['HTTP_X_REQUEST_ID'] ?? bin2hex(random_bytes(8));
header('X-Request-Id: ' . $requestId);

$logger->pushProcessor(new RequestContextProcessor($requestId));
Now every line your code emits for the rest of this request carries request_id. You filter on it in the aggregator, you see the whole story of one request in order, from "got auth token" through "validated payload" through "called payment API" through "wrote to outbox", without the noise of every other concurrent request in the pool.
Two practical notes:
The bin2hex(random_bytes(8)) shape gives you 16 hex characters, enough entropy for any realistic load, short enough to paste into a chat message. Some teams use Ramsey\Uuid for full UUIDs; both are fine. The Monolog built-in Monolog\Processor\UidProcessor does the same thing if you don't need to honour an inbound X-Request-Id header.
Honouring the inbound header matters more than it looks. When a request crosses three of your services, you want one ID to follow it through all of them so you can stitch the story across services. The convention everyone has converged on is use the incoming header if present, otherwise generate.
Log Levels: Stop Treating Them Like Vibes
PSR-3 defines eight levels. Most teams use five well and three poorly. Here's a working definition that holds up under real production pressure:
debug: only useful when you're actively debugging. Off in production by default. "Cache hit for key user:42".info: a thing happened that's worth a paper trail. "Order ord_4521 placed for usr_99".notice: a thing happened that's unusual but not wrong. "Retried payment after timeout; succeeded on attempt 2".warning: something might go wrong soon, or did go wrong but we recovered. "Outbound API returned 429; backing off".error: a request failed because of something we couldn't recover from. "Order ord_4521 declined: card_declined".critical: a feature is broken for everyone, not just this user. "Database connection pool exhausted".alert: wake someone up. "Payments provider returning 500 for >50% of requests".emergency: the service is down. "Cannot bind to listening port".
The split that matters most in practice is warning vs error. Warning is "this request might still succeed and is logged for trend analysis". Error is "this request failed; here's the reason a customer is going to complain". If you blur that line, your error-rate metric stops being meaningful and your alerts become noise.
Redaction: Don't Log What You Can't Be Trusted With
PHP backends touch payment cards, social security numbers, OAuth tokens, password hashes, and PII the regulator will ask about during an audit. The fastest way to fail a compliance review is to grep your logs for Bearer or 4242 and find them.
Two patterns work well, and both belong as Monolog processors so you can't forget to apply them.
The first is explicit allowlists: your info('order placed', $context) calls take whatever context they want, but a processor strips anything outside an allowlist before emitting. Loud, opinionated, and the safest default.
The second is denylist regex: a processor that walks the record and replaces anything that looks like a card number, JWT, email, or token with a placeholder.
use Monolog\Processor\ProcessorInterface;
use Monolog\LogRecord;

final class RedactingProcessor implements ProcessorInterface
{
    private const PATTERNS = [
        '/\b\d{13,19}\b/' => '[REDACTED_PAN]',
        '/Bearer\s+[A-Za-z0-9._\-]+/' => 'Bearer [REDACTED]',
        '/eyJ[A-Za-z0-9_\-]+\.[A-Za-z0-9_\-]+\.[A-Za-z0-9_\-]+/' => '[REDACTED_JWT]',
    ];

    public function __invoke(LogRecord $record): LogRecord
    {
        $record->message = $this->redact($record->message);
        $record->context = $this->walk($record->context);
        return $record;
    }

    private function walk(array $arr): array
    {
        foreach ($arr as $k => $v) {
            $arr[$k] = is_array($v) ? $this->walk($v) : (is_string($v) ? $this->redact($v) : $v);
        }
        return $arr;
    }

    private function redact(string $s): string
    {
        return preg_replace(array_keys(self::PATTERNS), array_values(self::PATTERNS), $s);
    }
}
Put it last in the processor stack, after request context, after user ID, just before emission. It's the layer that runs no matter who called the logger.
From Logs To Traces: The Jump You'll Eventually Make
At some point structured logs stop being enough. The classic moment: a customer reports that checkout takes 11 seconds. You filter your logs by request_id, you see twelve log lines, every line says it succeeded, and the gap between the first and the last is 11 seconds. Where did the time go?
That's traces. A trace is a tree of spans; each span is one operation with a start, an end, and a parent. You see the whole request as a flame graph, and the slow span lights up.
In PHP-land, the answer is OpenTelemetry. The official PHP SDK (open-telemetry/api, open-telemetry/sdk, plus exporters like open-telemetry/exporter-otlp) is mature enough for production. There's also a PECL extension (pecl install opentelemetry) that auto-instruments many common libraries (PDO, Guzzle, cURL, Symfony HttpKernel) without changes to your code.
Manual instrumentation looks like this:
use OpenTelemetry\API\Globals;

$tracer = Globals::tracerProvider()->getTracer('checkout');

$span = $tracer->spanBuilder('place_order')->startSpan();
$scope = $span->activate();

try {
    $order = $orderService->place($payload);
    $span->setAttribute('order.id', $order->id);
    $span->setAttribute('order.amount_cents', $order->amountCents);
} catch (\Throwable $e) {
    $span->recordException($e);
    $span->setStatus(\OpenTelemetry\API\Trace\StatusCode::STATUS_ERROR);
    throw $e;
} finally {
    $scope->detach();
    $span->end();
}
You don't need to wrap every function. The 80/20 is: wrap every outbound call (HTTP, database, cache, queue publish), and wrap any function that's a known long pole. Auto-instrumentation handles the first category for free.
Connecting Logs To Traces: The Field That Closes The Loop
Here's where it pays off. When you have both logs and traces, you want one field that lets you jump from a log line to its trace and back. That field is trace_id.
Inside an active span, you can pull the current trace ID and inject it into your logger's context:
use OpenTelemetry\API\Trace\Span;

$ctx = Span::getCurrent()->getContext();

$logger->info('order placed', [
    'order_id' => $order->id,
    'trace_id' => $ctx->getTraceId(),
    'span_id'  => $ctx->getSpanId(),
]);
Better: put it in a processor so every log line during the request carries it automatically.
final class TraceContextProcessor implements ProcessorInterface
{
    public function __invoke(LogRecord $record): LogRecord
    {
        $ctx = Span::getCurrent()->getContext();
        if ($ctx->isValid()) {
            $record->extra['trace_id'] = $ctx->getTraceId();
            $record->extra['span_id']  = $ctx->getSpanId();
        }
        return $record;
    }
}
Now your support flow becomes: customer reports a bug, you find the request by user_id, you copy the trace_id, you paste it into your tracing UI, and you see the whole flame graph. Logs and traces stop being two tools you switch between and start being one tool with two views.
Metrics: The Signal Most PHP Teams Skip
Logs and traces are about individual requests. Metrics are about aggregates. How many orders per minute. p95 checkout latency. error rate by endpoint.
PHP-FPM is a slightly awkward host for metrics because each request runs in a separate worker process; there's no long-lived in-memory counter you can increment and then scrape. The common patterns:
The simplest is structured logs as the source. Most observability platforms (Datadog, Honeycomb, Grafana Cloud) can derive metrics from log fields. Emit a log line with event: order_placed and amount_cents: 1999, and the platform builds a sum(amount_cents) by (currency) metric from it. No extra wiring. Trade-off: log-derived metrics carry the log pipeline's latency and cost.
The next step up is the OpenTelemetry meter API, which the PHP SDK supports. Counters and histograms get exported via OTLP to a collector that aggregates across workers. Better fidelity, more setup.
For "I just want Prometheus scraping" without a collector, StatsD is still the path of least resistance. php-statsd libraries push UDP packets to a local agent on every request, the agent aggregates, Prometheus or whoever scrapes the agent. Old-school, works fine.
Whichever path you pick, the principle is the same: emit counters and histograms with the same labels you already have in logs (endpoint, status_code, tenant_id), so your metric dashboards and your log filters line up.
PHP-Specific Pitfalls That Bite
A few traps that show up in PHP backends specifically:
Short-lived FPM workers. Each request is born, handles work, dies. There is no "logger instance with state that survives across requests". Anything you want consistent across requests has to either come from configuration at boot or be reconstructed per request. Don't keep an in-memory list of "the last 100 errors"; it won't survive, and worse, it's worker-local even when it does.
Long-lived workers under Swoole / RoadRunner / FrankenPHP. These flip the model. Now you have a single worker handling many requests in sequence. Your logger lives as long as the worker. That means processors that capture request state (like RequestContextProcessor above) must be scoped per request, not constructed once at boot. The pattern: don't pushProcessor at boot; push it in your request middleware and pop it on response. Forget this and you'll log request A's request_id on request B's lines.
Symfony / Laravel autoconfigure can hide channels. Both frameworks have their own logger configuration that wraps Monolog. You can absolutely use raw Monolog under them, but the framework expects you to define channels in its config. Mixing both styles ("we have an audit channel in config/logging.php AND we instantiate a fresh Logger('audit') somewhere") leads to two parallel pipelines with subtly different handlers. Pick one style per project.
error_reporting and PHP's own errors. Don't forget the language itself emits errors. Hook them into your logger with set_error_handler and set_exception_handler so an E_WARNING from a third-party library lands in the same JSON stream as everything else, with the same request_id. Otherwise you'll have two log languages running in parallel: yours, and PHP's.
set_error_handler(function ($severity, $message, $file, $line) use ($logger) {
    if (!(error_reporting() & $severity)) return false;
    $logger->warning($message, ['file' => $file, 'line' => $line, 'severity' => $severity]);
    return true;
});

set_exception_handler(function (\Throwable $e) use ($logger) {
    $logger->critical('uncaught exception', [
        'exception' => $e::class,
        'message'   => $e->getMessage(),
        'trace'     => $e->getTraceAsString(),
    ]);
});
A Minimum Viable Setup
If you want a concrete starting point, here's the smallest thing worth shipping. One Monolog logger, JSON to stdout (your container runtime catches it and ships it wherever), a request-context processor, a redactor, and a hook into PHP's own error stream.
use Monolog\Logger;
use Monolog\Level;
use Monolog\Handler\StreamHandler;
use Monolog\Formatter\JsonFormatter;
use Monolog\Processor\UidProcessor;
use Monolog\Processor\IntrospectionProcessor;

function bootLogger(): Logger
{
    $handler = new StreamHandler('php://stdout', Level::Info);
    $handler->setFormatter(new JsonFormatter());

    $logger = new Logger('app');
    $logger->pushHandler($handler);

    // Order matters: request context first, redaction last.
    $logger->pushProcessor(new UidProcessor(16));
    $logger->pushProcessor(new IntrospectionProcessor(Level::Warning));
    $logger->pushProcessor(new RedactingProcessor());

    return $logger;
}
Stdout instead of a file is deliberate. In containerised PHP-FPM the runtime catches stdout and routes it; one less moving part to fail. Files are fine on bare-metal hosts where you have a log shipper installed.
That's a one-screen logging setup that does the job a year out from now. Add channels when you need them. Add traces when "this request was slow" becomes a question you can't answer. Add metrics when "is the bug getting better or worse" is the question. None of these have to land on day one, but once they do, the floor of structured logs and correlation IDs is what makes them stitch together.
The Quiet Win
The honest pitch for all this isn't faster debugging. It's that observability stops being something you bolt on during an incident. The version of you who set up structured logs in week one of the project does less work during every incident for the next four years than the version who didn't.
It's not glamorous. Nobody's going to congratulate you for shipping a redactor processor. But the next time someone says "a customer says checkout is broken" and you reply "got it, here's the trace" in forty seconds, you'll know exactly which Tuesday afternoon paid for itself.