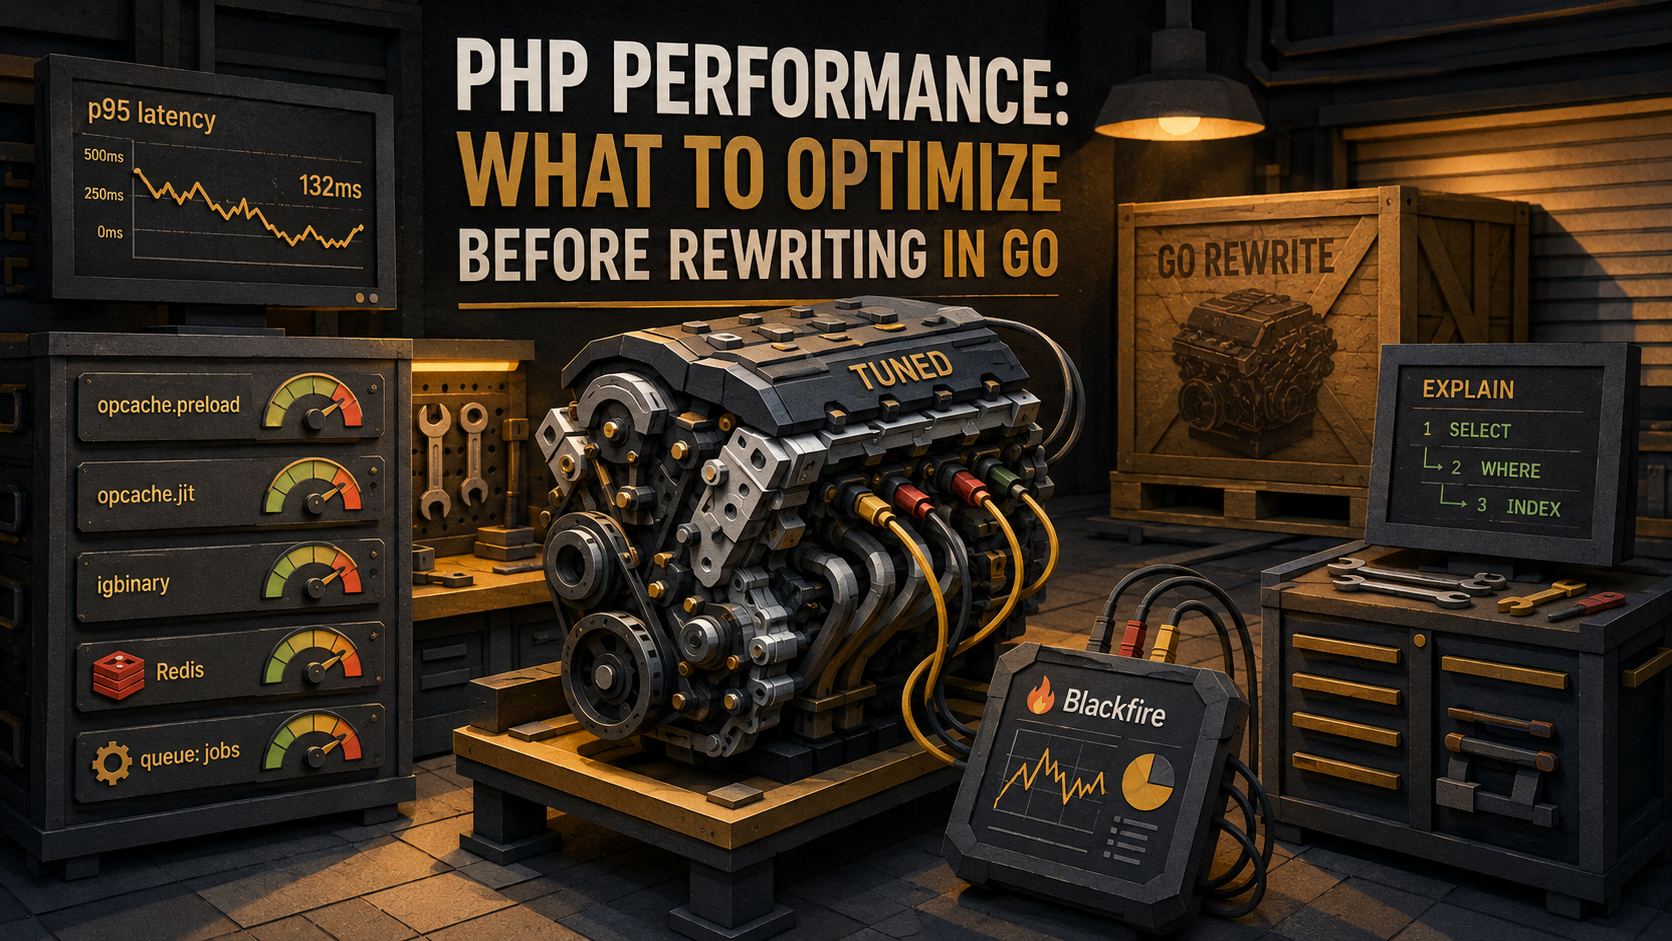
So you've been told the PHP service is the bottleneck.
Maybe a Slack thread is circulating about latency spikes. Maybe someone showed a graph at the leadership offsite. Maybe an engineer who joined six weeks ago has strong opinions about "modern stacks". Either way, the conversation has drifted toward the same destination it always drifts toward, "we should rewrite it in Go". And there's a chance that's the right call. Go is genuinely faster for some workloads, has lower memory overhead, and runs as a long-lived process so it doesn't pay startup costs on every request.
But here's the thing, most PHP services in the wild aren't slow because they're written in PHP. They're slow because nobody profiled them, OPcache is misconfigured or disabled, the ORM is firing twenty queries where one would do, the cache layer is doing one round-trip per item, and an enormous string is being serialized with the default serialize() on every page render. The PHP runtime is rarely the bug. The way PHP is being used almost always is.
This piece is the field guide I wish more teams had before signing up for a six-month rewrite. It's a tour of the boring optimizations that, in practice, close most of the gap between "PHP is too slow" and "PHP is fast enough that this service isn't the thing we should be touching right now". We'll go through profiling first, then OPcache, then the database, serialization, caching, queues, and what changes when you put PHP on a long-running runtime. At the end we'll talk honestly about when Go (or anything else) is actually the right move.
Measure first or you're just guessing
You don't get to skip this. If you can't point at a flame graph or a query log and say "this is where the time is going", every optimization below is a coin flip. You'll spend a week tuning OPcache when the actual problem was a JOIN missing an index, and you'll come away convinced "PHP can't go any faster", which is a story, not a measurement.
There are four profilers in widespread use, and you should pick one and learn it well rather than collect them.
Xdebug profiler. The dev-machine option. Set xdebug.mode=profile and xdebug.start_with_request=trigger, and you'll get cachegrind files you can open in KCachegrind or QCacheGrind. It's heavy, so don't run it in production. Good for "why is this one endpoint slow on my laptop".
Blackfire. A commercial profiler that's safe for production because it samples and only runs on triggered requests. It gives you a call graph with wall time, CPU time, IO time, memory, and SQL counts per function. The "comparison" view (one profile vs another) is the killer feature when you're testing a fix.
Tideways. Similar to Blackfire, production-safe, sampled, application performance monitoring with profiling. Strong PHP-specific story.
php-spx. Open-source profiler. Lower-friction than Xdebug, faster, has a nice live web UI. Worth knowing about for self-hosted needs.
Pick one. Run it against the actual slow endpoint with realistic data. Save the profile before you change anything, that's your before. Without it, you have no way to know if a change helped, hurt, or did nothing.
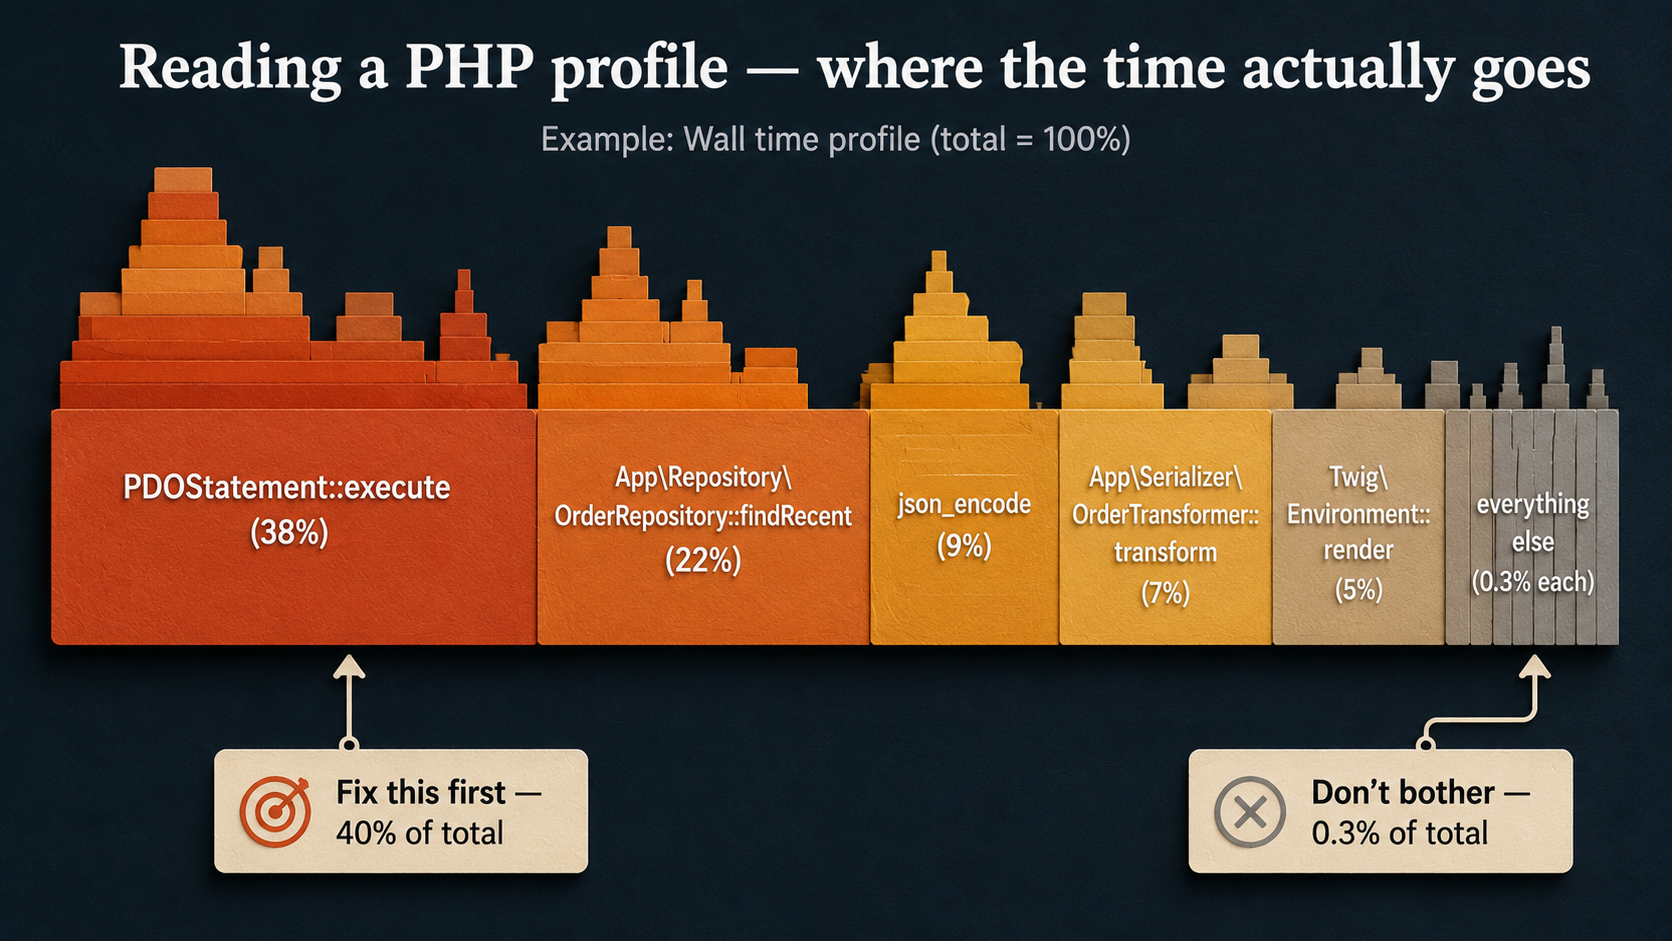
Once you have a profile, the question isn't "what could be faster". It's "what's eating the most time right now". Optimization is a sort by descending cost. The function eating 40% of wall time is the function you fix; the one eating 0.3% gets ignored even if it's ugly.
The other side of measurement is the database. Most PHP frameworks ship a query logger that's two lines of config away from being on. Turn it on in your local environment for the slow endpoint and count the queries.
# config/packages/dev/doctrine.yaml
doctrine:
    dbal:
        profiling: true
logging: true// In a service provider's boot()
use Illuminate\Support\Facades\DB;
use Illuminate\Support\Facades\Log;
DB::listen(function ($query) {
Log::debug($query->sql, [
'bindings' => $query->bindings,
'time' => $query->time,
]);
});The first time most people do this on a real endpoint they find some number between "surprising" and "horrifying", 47 queries to render a list of 20 orders, 200 queries for a dashboard, that kind of thing. We'll come back to that under the database section, but for now the point is: counting queries is the cheapest profiling you'll ever do.
OPcache, turn it on, then actually configure it
OPcache compiles your PHP files to bytecode and keeps that bytecode in shared memory so each request doesn't recompile from source. Without it, PHP-FPM parses and compiles every .php file it touches on every request, and this isn't subtle, you're often looking at a 2-3x slowdown without it.
The first check, every time you suspect a slow PHP service, is whether OPcache is actually doing its job. From any request handler:
<?php
header('Content-Type: application/json');
echo json_encode(opcache_get_status(false), JSON_PRETTY_PRINT);
What you want to see: opcache_enabled is true, cache_full is false, num_cached_scripts is in the same ballpark as the count of .php files in your project, hits is much, much higher than misses, and oom_restarts is 0. Anything else is a misconfiguration.
The settings that actually matter:
opcache.enable=1
opcache.enable_cli=0
opcache.memory_consumption=256
opcache.interned_strings_buffer=32
opcache.max_accelerated_files=20000
opcache.validate_timestamps=0
opcache.revalidate_freq=0
opcache.save_comments=1
opcache.fast_shutdown=1
Two of those matter more than the rest. opcache.memory_consumption has to be big enough to hold every compiled file in your project, plus headroom. The default 128 MB is fine for a small app and far too small for a Symfony or Laravel codebase with hundreds of dependencies. If cache_full ever flips to true in your status dump, you're effectively running without OPcache for any file that arrived after the cache filled.
opcache.validate_timestamps=0 is the big production win. With it set to 0, PHP never stat-checks your .php files to see if they changed on disk, it just trusts the cache. That removes a syscall per included file per request, which adds up fast. The cost is that to deploy new code, you must explicitly reset the cache (cachetool opcache:reset, a graceful PHP-FPM reload, or a container restart). On dev machines, leave it at 1 so your edits show up; in production, set it to 0 and reset on deploy.
Preloading
PHP 7.4 added opcache.preload, and most teams still haven't turned it on. It lets you load a list of files into shared memory once at startup, so they're already parsed, linked, and available as "always there" classes, no include overhead, no autoload roundtrip, no per-request cost.
<?php
// Preload your framework's hot path and your own infrastructure code.
// Pick files that are loaded on almost every request, not lazy paths.
opcache_compile_file(__DIR__ . '/vendor/symfony/http-kernel/Kernel.php');
opcache_compile_file(__DIR__ . '/vendor/symfony/http-foundation/Request.php');
opcache_compile_file(__DIR__ . '/vendor/symfony/http-foundation/Response.php');
// ... and your most-used app classes
opcache_compile_file(__DIR__ . '/src/Kernel.php');opcache.preload=/var/www/preload.php
opcache.preload_user=www-dataYou usually generate this list from a profile, the top N most-included files across realistic requests. Done well, preloading shaves another chunk off cold latency. Done badly (preloading everything, including rarely-used files), you're just slowing down PHP-FPM startup. Don't preload paths your hot endpoints don't touch.
JIT
PHP 8 added a JIT compiler (opcache.jit), and the marketing around it caused a lot of confusion. The honest version: for typical web workloads, request comes in, hit the DB, render a response, send it back, JIT helps a little or not at all, because most of the time isn't spent in PHP-level computation. It's spent in IO. JIT helps when you have CPU-bound PHP code: image manipulation in user-space PHP, heavy parsing, mathematical work.
opcache.jit_buffer_size=128M
opcache.jit=tracing
If your service does template rendering, query the DB, and JSON-encode the result, don't expect miracles from JIT. Measure before and after. If the difference is in the noise, leave it off, it's not free, and you've now got another layer to debug.
The database, usually where the time actually is
After OPcache, this is where the wins live. The single most common reason a PHP service is "slow" is that the request makes too many database queries, or the queries it makes are doing too much work.
N+1 is the headline act
Almost every team learns this on a dashboard. You load 50 orders. For each order, the template displays the customer's name. The ORM lazily loads each customer when you ask for it. You've made 51 queries, one for the orders, fifty for the customers, when you could have made two with a single join or WHERE customer_id IN (...).
$orders = Order::recent()->get();

foreach ($orders as $order) {
    echo $order->customer->name; // one query per order
}$orders = Order::recent()->with('customer')->get();
foreach ($orders as $order) {
echo $order->customer->name; // already loaded
}$qb = $em->createQueryBuilder()
->select('o', 'c') // hydrate both
->from(Order::class, 'o')
->join('o.customer', 'c') // single SQL with JOIN
->where('o.createdAt > :since')
->setParameter('since', new DateTime('-7 days'));
$orders = $qb->getQuery()->getResult();Tools that surface N+1 automatically are worth the time to wire in: barryvdh/laravel-debugbar, the Symfony web profiler, Telescope, Clockwork. They tell you per-request how many queries ran and which were duplicates. Once a team adopts one of these, N+1s stop shipping to production by accident.
Indexes, the boring part that pays for itself
If a query is slow, the answer is EXPLAIN. Always. Don't optimize a query by staring at it; ask the database what it's actually doing.
EXPLAIN
SELECT *
FROM orders
WHERE customer_id = 42
  AND status = 'pending'
ORDER BY created_at DESC
LIMIT 20;
If the type column says ALL, you're doing a full table scan. If rows is enormous and key is NULL, no index was used. Add the right composite index, for the query above, (customer_id, status, created_at), and the same query will use the index for filtering and ordering both.
A few things people get wrong here:
- Indexing every column. Indexes aren't free. They cost write throughput, disk, and buffer pool. Add the ones the slow queries actually need.
- Index column order. A composite index on
(a, b, c)helps queries that filter bya, bya, b, or bya, b, c. It does not help a query that filters bybalone. Order matters. - Functions break index use.
WHERE LOWER(email) = ?won't use an index onemailunless you've built a functional index. Either store the column already-normalized or use a functional index on the expression.
Connection setup and prepared statements
By default, pdo_mysql uses emulated prepared statements, it doesn't actually send a PREPARE to MySQL; it interpolates the values client-side and sends a regular query. This is fine for one-off queries; less fine when you're calling the same statement in a loop, because you don't get the server-side prepared-statement caching.
$pdo = new PDO($dsn, $user, $pass, [
    PDO::ATTR_EMULATE_PREPARES   => false,
    PDO::ATTR_ERRMODE            => PDO::ERRMODE_EXCEPTION,
    PDO::ATTR_DEFAULT_FETCH_MODE => PDO::FETCH_ASSOC,
]);
The other thing nobody thinks about until they look at a profile: connection setup. If your PHP service is opening a new DB connection on every request, that handshake is in the request path. Solutions, from cheapest to heaviest:
- Persistent connections.
PDO::ATTR_PERSISTENT => truekeeps connections alive across requests in the same PHP-FPM worker. Behavior is subtle, you inherit whatever session state the previous request left behind, so make sure you're not relying on per-connectionSETstatements. - External pooler. ProxySQL, PgBouncer (for Postgres), or RDS Proxy. The pool lives in front of the database; your PHP workers connect to it cheaply.
- Long-running PHP runtime. Once you're on RoadRunner, FrankenPHP, Swoole, or similar, the worker is alive for thousands of requests and connection setup happens once. We'll come back to this near the end.
Don't pull what you don't need
SELECT * is the lazy default and it's almost never the right one. If a page only needs three columns, ask for three columns. The data still has to travel from MySQL to PHP, get deserialized, and live in memory. On a wide row with a TEXT column you ignore, the savings are real.
The same applies to ORMs hydrating full objects when you only need a handful of fields. Doctrine's array hydration (Query::HYDRATE_ARRAY), Eloquent's ->select(['id', 'name', 'email']), raw query builders, they all sidestep the cost of constructing rich entity graphs you're going to throw away.
Serialization, quietly the slow part
This is the one that hides. You ran a profile and saw json_encode at 9%. You move on because "it's just JSON, what could be slow about it". But on big payloads, serialization is genuinely expensive. And the default tools are not the fastest tools.
For PHP-internal serialization (Redis cache values, session payloads, queued job arguments), igbinary is dramatically faster and smaller than the default serialize(). It's a PHP extension and a one-liner in php.ini once installed.
session.serialize_handler=igbinary$packed = igbinary_serialize($value); // bytes
$value = igbinary_unserialize($packed);For Redis specifically, the predis/phpredis client lets you pick a serializer. phpredis with the igbinary or msgpack serializer is a clean win over plain PHP serialization for anything bigger than a few hundred bytes.
$redis = new Redis();
$redis->connect('127.0.0.1', 6379);
$redis->setOption(Redis::OPT_SERIALIZER, Redis::SERIALIZER_IGBINARY);
For wire-format JSON to clients, json_encode is fine for most loads. If you're returning genuinely huge documents and JSON encoding shows up at the top of your profile, the levers are:
- Send less data. Almost always the right answer.
- Pre-cache the encoded JSON string so you don't re-encode on every request.
- Switch to a streaming encoder if the response is large enough that buffering hurts.
- Consider a binary format for internal services where the consumer isn't a browser.
The other quiet trap is deep objects. PHP's serializer walks the whole graph. If your "user" object lazily pulls in addresses, orders, and preferences, serializing it for a cache write can drag in half the database. Use DTOs for cached values, small, flat objects with only the fields the consumer needs.
Caching, layered, with eviction in mind
Caching is the single biggest lever you have, and it's also the easiest to get wrong. The wrong cache layer can hide bugs, store stale data forever, and stampede your database when it expires.
The mental model that holds up: think of it as layers, from cheapest to most expensive, and try to answer each request as high in the stack as possible.
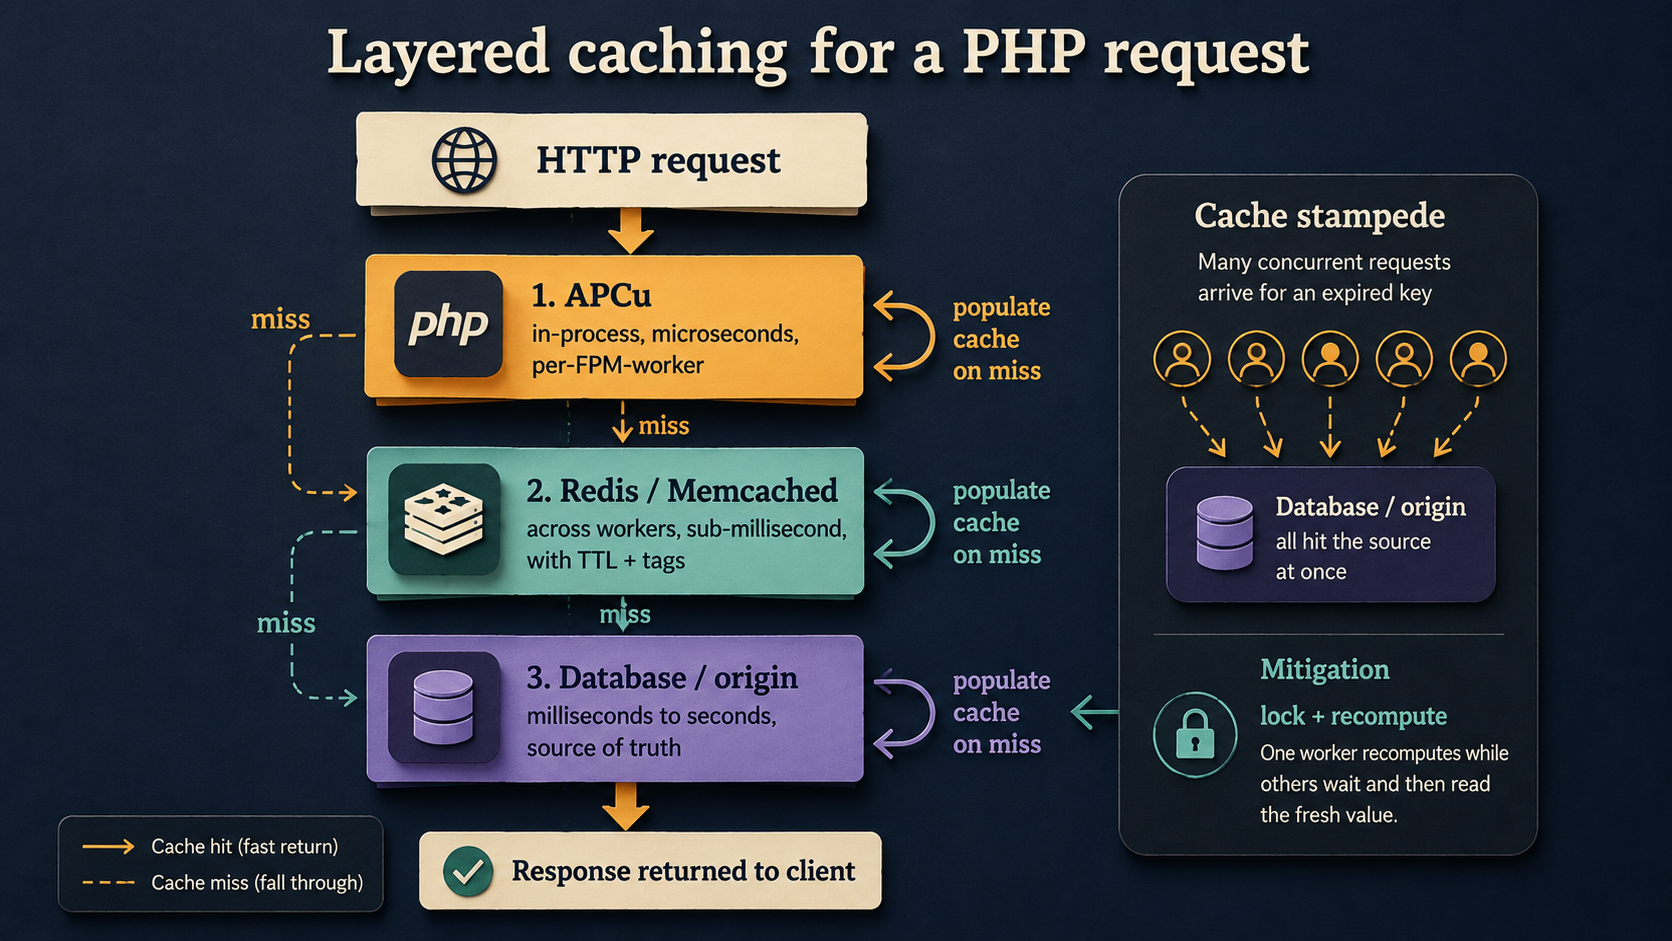
APCu lives in each PHP-FPM worker's memory. It's the fastest cache you can have, no network, no serialization for the request, but it's worker-local. Worker A's cache doesn't know about worker B's, and a deploy wipes it. Use it for things that are slow to compute and tolerate per-worker duplication: route tables, parsed config, compiled translations, feature flag snapshots. A typical pattern:
$key = 'features.snapshot';
$ttl = 30; // seconds

if (apcu_exists($key)) {
    $features = apcu_fetch($key);
} else {
    $features = $featureService->snapshot(); // slow
    apcu_store($key, $features, $ttl);
}
Redis or Memcached sit across workers and survive deploys. They're a network hop away, sub-millisecond on the same host, single-digit milliseconds across a small network, but everything you store there is visible to every worker. This is where session data, "expensive query results", rate limit counters, and anything that needs to be consistent across the fleet should live.
The database itself is the source of truth. Cache invalidation is a tax you pay for everything you put higher in the stack, so don't promote something to a cache layer unless you actually have a problem.
Cache stampede, the failure mode you only see at scale
Imagine you cache a heavy report for 5 minutes. At minute 5, the cache expires. The next 50 concurrent requests all see "miss", and all 50 run the heavy query against the database. You just got hit with a thundering herd, and your database wonders what it did wrong.
There are a few mitigations and you should use at least one if the underlying compute is expensive:
- Mutex / lock. First request to see a miss takes a lock and recomputes; the others wait or return the stale value. Most cache libraries ship this, Symfony's
LockingCacheTrait, Laravel'sCache::lock, or roll your own withSETNXin Redis. - Probabilistic early expiration. Before the TTL hits, a small fraction of requests treat the cache as "expired" early and refresh it in the background, so it never actually goes cold for the herd.
- Serve stale while revalidate. Always serve the cached value; refresh out-of-band on a worker. Strong choice for things where eventual consistency is fine.
Get the round-trip count down
If your code looks like this, you're paying the network round-trip cost N times:
foreach ($ids as $id) {
    $user = $redis->get("user:$id");
    // ...
}
Use a pipeline or MGET. One network round-trip, N values back:
$keys   = array_map(fn ($id) => "user:$id", $ids);
$values = $redis->mget($keys);
Or pipeline arbitrary commands:
$replies = $redis->pipeline(function ($pipe) use ($ids) {
    foreach ($ids as $id) {
        $pipe->get("user:$id");
    }
});
This is the same lesson as N+1 with the database, in a different room.
Queues, move it off the request path
Sometimes the request can't be made fast, because the work it has to do is genuinely heavy. Sending five emails. Generating a PDF. Recalculating a recommendation set. Refreshing an external API token.
The fix is to stop doing the work during the request. Push a job onto a queue, return the response, and let a worker handle it asynchronously.
SendReceiptEmail::dispatch($order)->afterResponse();$messageBus->dispatch(new SendReceiptEmail($order->getId()));Two things tend to trip teams up here:
Idempotency. Queue workers can retry. Network blips happen. If a job runs twice, your system better not send the email twice, charge the card twice, or create two rows. Design jobs so re-running them either has no effect (because state already matches what they'd produce) or fails fast at a unique constraint.
Job size. Don't put a giant object into the queue payload. Put the IDs the worker needs to load fresh. The worker should not be reading a six-month-stale serialized blob from a queue and acting on it.
The payoff is two-sided. Response latency drops because you're returning before the slow work happens. And, if your queue worker pool is sized separately from your web pool, you can scale the two independently. A traffic spike doesn't have to mean a worker spike, and a long-running batch job doesn't have to clog the request pool.
Long-running PHP, the runtime question
There's a whole class of optimization that comes from removing PHP's "everything dies at end of request" model. The classical PHP request lifecycle is: fork a worker, parse + execute, send response, throw away everything you built up. That's elegantly simple and surprisingly costly when "everything you built up" includes the Symfony container, every service definition, all the routing tables, and the database connection.
Three runtimes change this:
- RoadRunner, Go-based application server that runs PHP workers as long-lived processes. Your framework boots once per worker, then serves thousands of requests before being recycled.
- FrankenPHP, built on Caddy, embeds PHP, and supports a "worker mode" that's conceptually similar.
- Swoole / Open Swoole, a PHP extension that gives you an event loop and long-running processes; more invasive to adopt but powerful.
The wins are real: framework bootstrap moves out of the request path, the OPcache stays warm, DB connections stay open, in-memory caches actually persist across requests. The trade-off is real too: you have to write code that doesn't leak state between requests. A static cache, a global, a connection you never reset, anything you'd casually rely on getting cleaned up by php-fpm recycling, is now your problem.
For services that are at "PHP-FPM isn't cutting it" but still firmly inside what PHP can do well, this is often the optimization that buys back the most headroom without changing language. If you're considering a Go rewrite specifically because of per-request overhead, you owe it to yourself to spend a week on RoadRunner or FrankenPHP first and re-measure.
A few things that are not the optimization you think they are
A short pile of things that come up in performance discussions and aren't usually the lever:
- Microbenchmarks of
array_mapvsforeach,==vs===, single vs double quotes. None of these are wrong, but in any real service they're rounding errors next to the database and serialization costs. Don't litter PR reviews with them. - PHP-FPM
pm.max_childrentuning, without a profile. If your workers spend most of their time waiting on the DB, increasing children just turns DB contention into more DB contention. Fix the slow query first; then tune the worker pool to the new throughput. - Switching frameworks "for performance". The framework is rarely the slow part. There are real differences between Symfony, Laravel, Slim, Mezzio, etc., but for a typical service the cost of the rewrite dwarfs the runtime difference.
- Aggressively turning off Composer's autoloader features. Composer's authoritative classmap (
composer dump-autoload -o -a) is the right call in production. Beyond that, the autoloader is not where your time is going.
So, should you rewrite in Go
Sometimes, yes. Honestly. There are workloads where Go is the better fit and the rewrite is worth it. The clear ones:
- High-concurrency, long-lived connections. Websocket gateways, server-sent event fanouts, anything that's holding tens of thousands of sockets open. PHP's request-per-process model is genuinely the wrong shape here.
- CPU-bound work where you actually measured the CPU. Real-time signal processing, large-scale image or video manipulation in-process, cryptographic work at scale. JIT helps PHP some, but Go's compiled performance and goroutine scheduling are in a different league.
- Tiny, latency-critical services. A service whose entire job is "look up a value in memory and return it in 200 microseconds". The framework boot cost in PHP, even on a long-running runtime, is non-trivial relative to that budget.
The less-clear ones, the cases where "rewrite in Go" gets brought up and shouldn't, usually look like this:
- Endpoints are slow because of unoptimized SQL. Go won't fix your queries.
- Memory usage is high because the framework is hydrating huge object graphs. Go won't fix that either; you can build the same problem in Go.
- The team is bored of PHP and wants a side quest. This is a real reason and an honest one, but it deserves to be named rather than dressed up as a performance argument.
Before you decide, do this. Pick the slowest endpoint. Profile it. Walk through the list above, OPcache configured, queries minimized, indexes in place, serialization sane, layered cache in front, heavy work queued, runtime appropriate. Get the p95 latency to the lowest number a PHP application can credibly produce. If you've done that work and the number is still wrong for your use case, then the rewrite conversation is honest, because you know what PHP can do and you know it isn't enough.
The rewrite is a story you tell yourself. The boring optimizations are the ones that actually work. Run the profile.


