
You've got a test that fails once every two hundred runs. Maybe once every two thousand. You re-run it, it passes. You add a log line, it passes. You ship it, and two weeks later a customer hits the exact same panic in production at 3am while you're asleep.
Welcome to data races in Go.
The cruel part is that Go makes concurrency look easy. You type go in front of a function call and you've got a goroutine. You share a variable between two of them and the compiler shrugs and says sure. Nothing flags. Tests pass. CI is green. And then, on a Tuesday, two goroutines touch the same map at the same nanosecond and your service dies with fatal error: concurrent map writes.
This article is about three things, in order:
- What a data race actually is, and why Go can't catch it for you at compile time.
- The race detector, the single most useful tool Go ships for this problem, and how to actually use it in tests and CI.
- The fix layer:
sync.Mutex,sync.RWMutex, andsync/atomic, and when each one is the right call.
By the end you should be able to look at a goroutine, ask "who else touches this memory?", and have a clear answer for what to do about it.
What a race condition actually is
Let's get the vocabulary straight, because people use these two terms interchangeably and they aren't quite the same thing.
A race condition is a logical bug: the correctness of your program depends on the timing or ordering of events that the runtime doesn't guarantee. Two requests arrive at the same time, both read your "is this username taken?" check, both see "no," both write the same row. That's a race condition. It would happen even with a perfectly fine database. The problem is at the application logic level.
A data race is narrower and meaner: two goroutines access the same memory location, at least one of them is a write, and there's no happens-before ordering between them. That's what Go's memory model defines as undefined behavior. Not "might give a wrong answer" but undefined. The compiler is allowed to optimize as if the race never happens, and the CPU is allowed to reorder reads and writes around it. Your variable can briefly hold a value neither goroutine ever wrote.
Every data race is a race condition. Not every race condition is a data race. You can have a race condition that lives entirely in the database, with no shared memory in your Go process at all.
We're focusing on data races here, because that's the kind Go gives you tools to find.
The smallest example that breaks
Here's the classic. Two goroutines, one shared counter, no synchronization:
package main

import (
    "fmt"
    "sync"
)

func main() {
    var counter int
    var wg sync.WaitGroup

    for i := 0; i < 1000; i++ {
        wg.Add(1)
        go func() {
            defer wg.Done()
            counter++
        }()
    }

    wg.Wait()
    fmt.Println("counter:", counter)
}
You'd expect 1000. What you'll actually see varies: 987, 994, sometimes 1000 by sheer luck. Run it a few times and watch the number change.
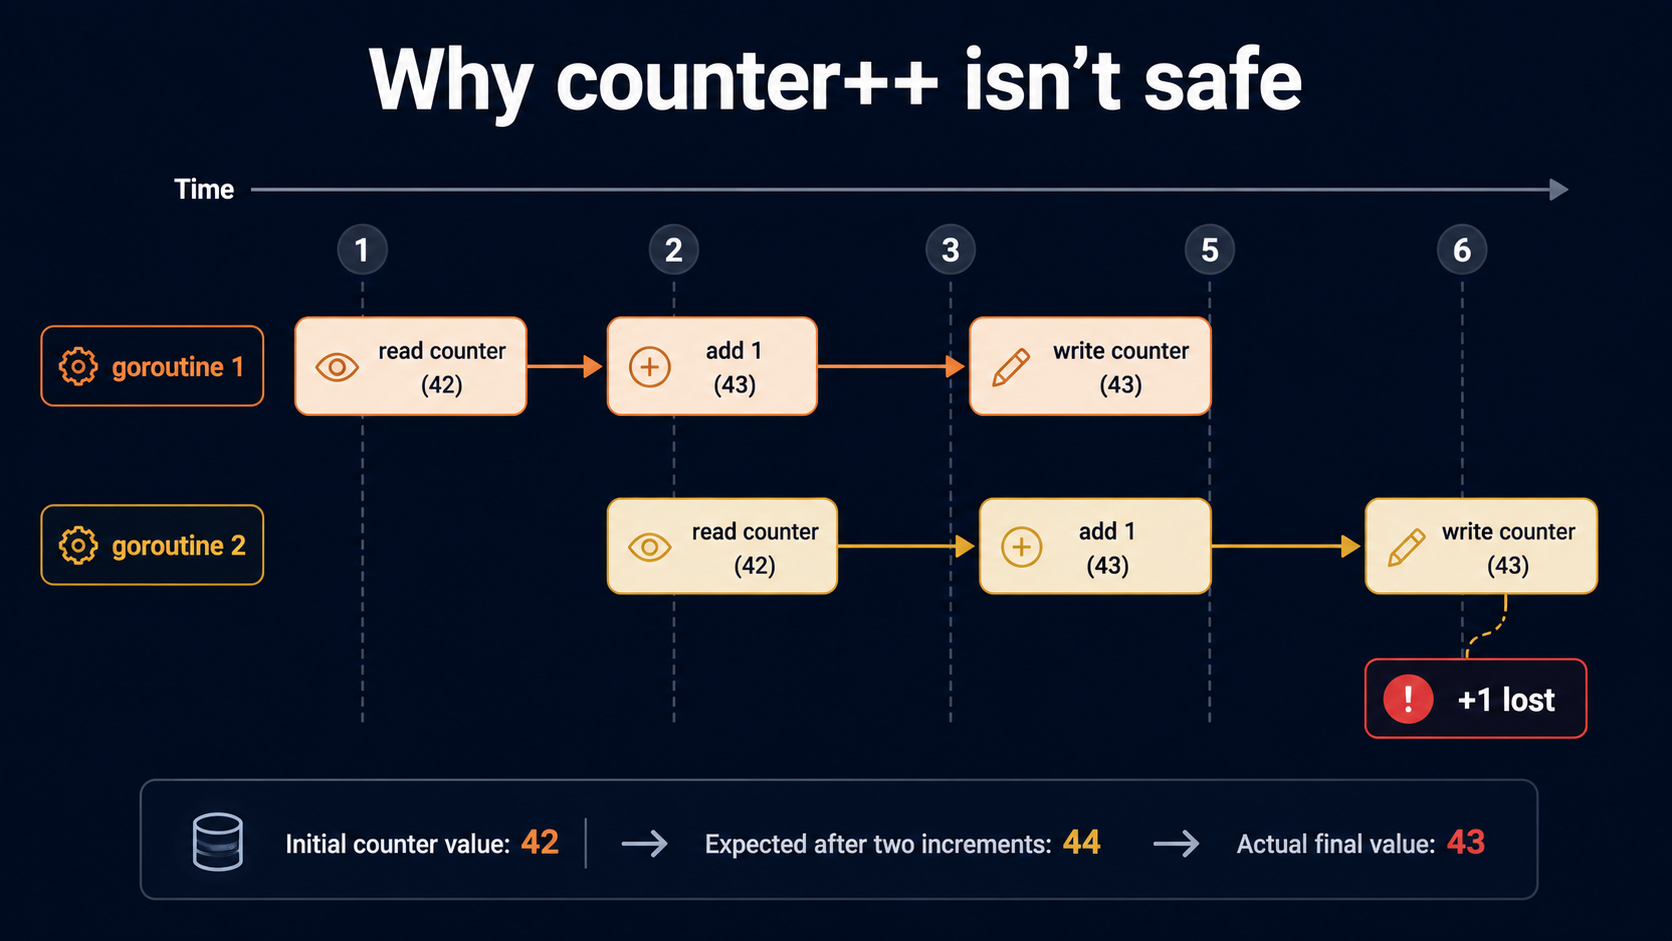
The bug is that counter++ isn't one operation. It's three: read the current value, add one, write it back. Two goroutines can both read 42, both compute 43, both write 43. One increment vanished into the gap between the read and the write. Multiply that across a thousand goroutines and you've got a pile of lost updates.
The really uncomfortable thing is that the program is wrong even when it prints 1000. The output happening to look right doesn't mean the program is right. The data race is a property of the code, not of any particular run.
The race detector: Go's single best feature for this
Here's the part that makes Go genuinely pleasant to work with: you don't have to spot races by reading code. The runtime can spot them for you.
Go ships with a built-in race detector. You enable it with the -race flag on any of the standard tools:
go run -race ./...
go test -race ./...
go build -race -o myapp ./cmd/myapp
That last one is worth knowing about. You can build a -race-instrumented binary and deploy it to a staging environment for a few hours. Production-grade race hunting.
When you run the counter example with -race, you get something like:
==================
WARNING: DATA RACE
Read at 0x00c0000180a8 by goroutine 8:
  main.main.func1()
      /tmp/race_counter.go:15 +0x4a

Previous write at 0x00c0000180a8 by goroutine 7:
  main.main.func1()
      /tmp/race_counter.go:15 +0x60

Goroutine 8 (running) created at:
  main.main()
      /tmp/race_counter.go:13 +0x9c
==================
Found 1 data race(s)
That output is your new best friend. It tells you:
- The memory address being raced on.
- The two goroutines involved, with stack traces showing where each one accessed it.
- Where those goroutines were created, so you can trace the spawn site, not just the conflict site.
The race detector is built on top of ThreadSanitizer (TSan), the same C/C++ tool that finds data races in things like Chrome and the Linux kernel. It's not a heuristic. If -race says you have a data race, you have a data race. There are no false positives in well-formed code. (False negatives are possible, though. More on that in a minute.)
What -race costs you
The instrumentation isn't free. The official Go docs put it this way: memory usage can grow roughly 5-10x and execution time can grow roughly 2-20x with -race on. You also need to be on a 64-bit platform to use it at all.
That cost is why you don't ship a -race binary to production by default. It's also why a lot of teams skip -race in CI, which is a mistake. Even if your full integration suite is too slow with -race, you can usually afford to run your unit tests with it. That alone catches most of the dumb stuff.
What -race won't catch
The detector only reports races it actually observes during execution. That's the catch.
It can't find a race in a code path your tests never hit. It can't find a race that needs three goroutines to interleave in a way only happens under real production load. It can't see across processes, so a race between your Go service and a separate worker is out of scope.
The mental model: -race is a great drug-sniffing dog at the airport. It doesn't search the whole world, only the bags that walk past it. Get more bags walking past. Write tests that actually spin up goroutines, that fan out work, that share state, and you'll catch more.
Fix #1: sync.Mutex
The simplest fix for a shared variable is to make it not-actually-shared. Wrap it in a mutex so only one goroutine touches it at a time.
type SafeCounter struct {
    mu    sync.Mutex
    value int
}

func (c *SafeCounter) Inc() {
    c.mu.Lock()
    defer c.mu.Unlock()
    c.value++
}

func (c *SafeCounter) Value() int {
    c.mu.Lock()
    defer c.mu.Unlock()
    return c.value
}
A few things to notice.
The mutex and the data it protects are bundled into the same struct. That's not a style preference; it's the only way to make it obvious what the mutex protects. A lone sync.Mutex floating in package scope, with no comment about what it guards, is a small disaster waiting for a new hire.
The defer c.mu.Unlock() is doing real work. If c.value++ somehow panicked (it can't here, but pretend), the unlock would still run on the way out of the function. Without defer, a panic inside the critical section leaves the mutex locked forever and every other goroutine deadlocks behind it.
Value() locks too, and that surprises people. "I'm only reading, why do I need a lock?" Because reading a value while another goroutine is writing it is itself a data race. The Go memory model doesn't promise that an int read is atomic. On most architectures it happens to be, but "happens to be" is not a guarantee you want to bet a production service on.
The five mutex mistakes
A short menu of ways people get this wrong:
1. Forgetting to unlock. Always use defer. Always. The one place you might skip defer is a critical section in a hot inner loop where you've measured the overhead, and even then you write a comment explaining why.
2. Copying a struct that contains a mutex. A sync.Mutex must not be copied after first use. This bites you when you write c := *counter or pass a struct by value to a method. Go's vet will warn you about this. Run go vet ./... on every commit.
3. Locking around the wrong thing. Holding the lock while you make a network call. Holding the lock while you log to stdout. The longer the critical section, the more contention you introduce. Lock the smallest chunk of code that genuinely needs protection.
4. Re-locking from the same goroutine. sync.Mutex isn't reentrant. If A() locks the mutex and calls B(), and B() also tries to lock the mutex, you get a deadlock. There's no recursive variant in the standard library. If you find yourself wanting one, your function boundaries are wrong.
5. Forgetting that Value() needs a lock too. See above. Reading while someone else writes is still a race.
When to reach for sync.RWMutex
If your access pattern is reads-heavy (many goroutines reading, few writing), sync.RWMutex lets multiple readers hold the lock at the same time:
type Cache struct {
    mu   sync.RWMutex
    data map[string]string
}

func (c *Cache) Get(key string) (string, bool) {
    c.mu.RLock()
    defer c.mu.RUnlock()
    v, ok := c.data[key]
    return v, ok
}

func (c *Cache) Set(key, value string) {
    c.mu.Lock()
    defer c.mu.Unlock()
    c.data[key] = value
}
Writers still need exclusive access (Lock / Unlock). Readers can share (RLock / RUnlock). The win is real when you have a 1000:1 read-to-write ratio.
The trap: RWMutex is more expensive than Mutex per operation. If your critical section is tiny (a single map read), the overhead of the read lock can be worse than just using a plain Mutex and serializing the reads. Benchmark before you assume RWMutex is faster. "It's a cache, of course we want RWMutex" is intuition, not measurement.
Fix #2: sync/atomic
For very small operations on basic types (counters, flags, sequence numbers), you can skip the mutex entirely and use the sync/atomic package.
import "sync/atomic"

type AtomicCounter struct {
    value atomic.Int64
}

func (c *AtomicCounter) Inc() {
    c.value.Add(1)
}

func (c *AtomicCounter) Value() int64 {
    return c.value.Load()
}
That's it. No mutex, no defer. The hardware does the locking for you, at the level of a single CPU instruction. Add, Load, Store, Swap, and the famous CompareAndSwap are all available on atomic.Int32, atomic.Int64, atomic.Uint32, atomic.Uint64, atomic.Bool, and atomic.Pointer[T]. (Those typed structs landed in Go 1.19. The older atomic.AddInt64(&x, 1) style functions still work and you'll see them everywhere in older codebases; they do the same thing, just with raw pointers.)
When does this beat a mutex?
When the protected operation is one number going up, or one flag flipping, or one pointer being swapped. Anything you'd write as a single CPU op anyway. The atomic version is faster, sometimes dramatically faster under contention, because there's no parking the goroutine, no kernel call, no context switch.
When does this not work?
The moment your "operation" is more than one thing. "Increment the counter and add the request to the slice" is two operations. Atomic gives you no help here. You need a mutex around both, because the invariant you care about (the counter equals the slice length) lives across both writes.
// Wrong: counter and slice can drift apart.
atomic.AddInt64(&total, 1)
mu.Lock()
items = append(items, req)
mu.Unlock()

// Right: one critical section, one invariant.
mu.Lock()
total++
items = append(items, req)
mu.Unlock()
A useful rule: if you can describe the protected thing as "a single value," atomic is on the table. If you can't, reach for a mutex.
CompareAndSwap, briefly
CompareAndSwap (CAS) is the building block of every lock-free algorithm you've ever heard of. The idea: "set this value to X, but only if it's still Y. If it's not, tell me what it is now."
var started atomic.Bool

func StartOnce() bool {
    return started.CompareAndSwap(false, true)
}
StartOnce returns true exactly once per program, no matter how many goroutines call it. That's a one-line "run this initialization exactly once" pattern. (sync.Once does the same job with a friendlier API, and you should usually use that. But it's nice to see CAS in its simplest form.)
CAS gets seductive fast. You read one article about lock-free queues and suddenly you're writing 200 lines of for { x := load(); ...; if cas(old, new) { break } }. Resist the urge in application code. Lock-free data structures are notoriously hard to get right, and the wins almost never matter outside of standard libraries and hot inner loops in performance-critical systems.
Patterns that quietly cause races
The counter example is honest. You can see the shared variable. The races that actually hit you in production are sneakier. A few worth memorizing:
Concurrent map access
Maps in Go are explicitly not safe for concurrent use. Even concurrent reads are fine, but the moment one goroutine writes while another reads, you get a data race. The runtime now actively checks for it and you'll see fatal error: concurrent map writes, and the process dies. No recover. No graceful shutdown. Gone.
Fix it with a mutex around the map, or use sync.Map if your access pattern matches its specialty (mostly-disjoint keys across goroutines).
The closure-captured loop variable
The classic Go gotcha, and the cause of more 2am pages than I want to count:
for _, item := range items {
    go func() {
        process(item)
    }()
}
Before Go 1.22, item was a single variable, reused across iterations. Every goroutine captured the same variable, and by the time the goroutines ran, item had already moved on to the last value in the slice. Every goroutine processes the last item. Or, depending on scheduling, some weird mix. Classic data race, classic "works fine in tests, breaks under load".
The fix was to shadow the variable:
for _, item := range items {
    item := item // shadow it
    go func() {
        process(item)
    }()
}
Or pass it in explicitly:
for _, item := range items {
    go func(item Item) {
        process(item)
    }(item)
}
Go 1.22 changed the semantics: loop variables are now per-iteration scoped by default, and this whole class of bug went away for new code. But you're still going to run into this in any codebase older than that, and the explicit shadow is still the safer, more readable form. Don't assume your codebase is on 1.22+. Check go.mod.
Sharing a slice header
A slice in Go is a small struct: pointer, length, capacity. When you pass a slice to a goroutine, you're sharing the underlying array, not copying it. Two goroutines writing into the same backing array is the same data race as two goroutines writing into the same int.
If the work is read-only, you're fine. If anyone writes, even an append that triggers a re-allocation, you need synchronization or you need to give each goroutine its own slice to write into.
Returning a pointer from a function called in a goroutine
var current *Config

func reload() {
    new := loadConfig()
    current = new // race with every reader
}
Readers reading current while the writer assigns it isn't a "well, you'll get either the old one or the new one." On some architectures, a 64-bit pointer write isn't atomic. A reader can briefly see a half-written pointer and dereference garbage. Use atomic.Pointer[Config] for the load and store, or guard the assignment with a mutex.
How to actually find races in a real codebase
You know what the tools are. The question is how to use them so races stop reaching production.
Run -race in CI on every PR. Not "on the nightly build." Not "for the release branch." Every PR. The earlier you catch it, the cheaper it is.
Write tests that actually exercise concurrency. A unit test that calls one method one time will never trip the race detector. Spawn 100 goroutines, hammer the shared resource, wait for them all, check the invariant. A test like this:
func TestCacheConcurrent(t *testing.T) {
    c := NewCache()

    var wg sync.WaitGroup
    for i := 0; i < 100; i++ {
        wg.Add(1)
        go func(i int) {
            defer wg.Done()
            c.Set(fmt.Sprintf("k%d", i), "v")
            _, _ = c.Get(fmt.Sprintf("k%d", i))
        }(i)
    }
    wg.Wait()
}
It barely asserts anything. That's fine: its job is to give the race detector something to chew on.
Ship a -race binary to staging. Not forever. For a soak period. Build with go build -race, deploy it behind a feature flag or to one canary instance, let it take real traffic for a few hours. The 5-10x memory overhead is fine in staging. You'll find races that no unit test would ever hit.
Run go vet too. It catches mutex-copy bugs, suspicious unsafe.Pointer use, and a few other things -race doesn't. It's free. Wire it into the same step that runs your tests.
When -race flags something, fix it. Don't suppress it. Don't skip the test. Don't write a // nolint and move on. A flagged race is a real bug. The next person to look at the suppression will assume it was investigated and won't re-investigate. That's how races graduate from "annoying" to "load-bearing."
A short decision guide
When you're staring at some shared state and trying to figure out what to do:
- Is this a single integer or boolean or pointer that one goroutine flips and others read?
sync/atomic. Use the typed structs (atomic.Int64,atomic.Bool); they're harder to misuse than the raw functions. - Is this a struct, a map, a slice, or anything where the invariant lives across multiple fields?
sync.Mutex. Embed it next to the data. Usedefer Unlock. - Is this reads-heavy with rare writes, and the critical section is non-trivial?
sync.RWMutex, but benchmark to confirm the reader concurrency actually helps. - *Is the goroutine ownership pattern "one goroutine owns the state, others ask via messages"?* A channel, and this article isn't about that. See the channels article for the patterns there.
- Is this initialization that needs to run exactly once?
sync.Once.
The Go memory model rewards clarity. Every piece of mutable state in a concurrent program should have a one-sentence answer to "who is allowed to touch this, and how do they coordinate?" If you can't write that sentence, that's the bug, not the missing mutex.
Run -race on every test. Build the typed atomics into your reflexes. Keep the mutex next to the field it protects. The races will still happen. You'll just catch them in a test before they catch you in production.