
So, you've shipped a few apps on MongoDB and everything's been fine.
Reads are fast, writes are fast, the schema bends when product changes its mind on a Tuesday, and life is good. Then a year goes by. Traffic creeps up. A single endpoint starts taking three seconds. A single document refuses to update. Atlas sends you a "working set exceeds RAM" email at 2am.
And when you go looking for what changed, it's not really one bug. It's three or four design decisions you made back when the collection had 8,000 documents in it, and which only became expensive once the collection had 80 million.
That's the thing about MongoDB. It doesn't yell at you on day one. It hands you a very forgiving toolkit and lets you put a foot in the wrong place quietly. Most of the production pain I've seen (and that you'll probably see too if you keep apps running long enough) comes from three patterns that look innocent in code review.
Let's look at them.
Anti-pattern 1: Unbounded arrays inside a document
This is the most common one, and it's the easiest to write without realising you've written it.
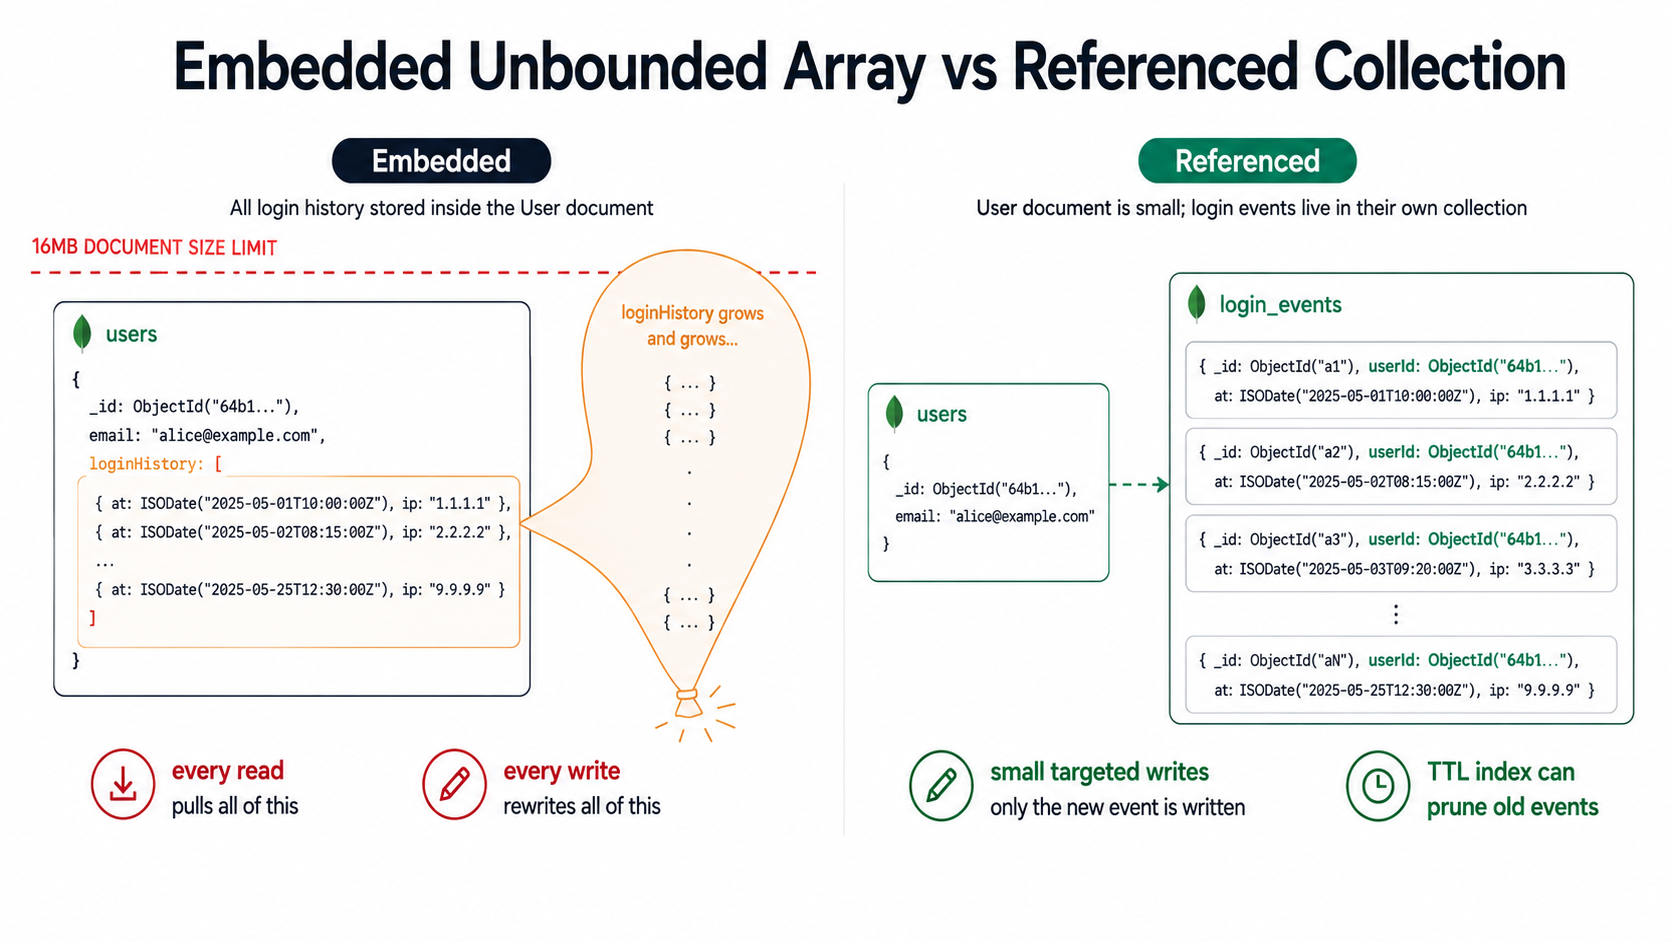
You have a User document. You add a loginHistory array. Every login pushes one entry. Six months later, a power user has 14,000 entries in there. The document is suddenly 4MB. Every read pulls 4MB over the wire. Every write rewrites 4MB on disk. Indexes on that document are awful to maintain. And the team is wondering why the login endpoint started timing out.
The pattern looks like this:
// A reasonable-looking schema that's a time bomb
const UserSchema = new mongoose.Schema({
  email: { type: String, required: true, unique: true },
  loginHistory: [
    {
      ip: String,
      userAgent: String,
      at: Date,
    },
  ],
  notifications: [
    {
      type: String,
      seen: Boolean,
      at: Date,
    },
  ],
  cartItems: [
    {
      productId: mongoose.Schema.Types.ObjectId,
      addedAt: Date,
    },
  ],
});
Three arrays. None of them have an upper bound. None of them are something the user will ever stop adding to. And all of them live inside the same document as email, which gets read on every authenticated request.
A document in MongoDB has a hard cap of 16MB. Long before you hit that ceiling, the document becomes painful for reasons that have nothing to do with the limit itself:
- Every read pulls the whole document by default.
findOne({ email })returns the 4MB blob even if you only wanted the email. Projection helps, but most app code doesn't use it. - Every update rewrites the whole document on disk. Even a simple
$pushends up amplifying writes much more than it should. - Indexes on fields inside that growing array (say,
notifications.seen) get larger and slower with every push. - Replication and oplog entries bloat. Larger documents mean more storage and higher Atlas bills.
So how do you spot it before it's a problem? The honest answer is: assume every array in a schema is unbounded unless you can name the upper bound out loud. If you can say "this array will have at most 5 items, period, because a user can have at most 5 addresses," it's fine. If you find yourself saying "well, probably it won't get that big," it will get that big.
The fix: pull the array out into its own collection
The boring, durable fix is to move the array into a separate collection where each item is its own document, and store a reference back. That's it. That's the whole pattern.
const LoginEventSchema = new mongoose.Schema({
  userId: { type: mongoose.Schema.Types.ObjectId, ref: "User", index: true },
  ip: String,
  userAgent: String,
  at: { type: Date, default: Date.now, index: true },
});

// User schema, after the refactor
const UserSchema = new mongoose.Schema({
  email: { type: String, required: true, unique: true },
  // No more loginHistory here. It lives in login_events.
});
Now the user document stays small. Logins are one-document writes. You can query the last 10 logins with find({ userId }).sort({ at: -1 }).limit(10). You can purge old events with a TTL index. You can shard the events collection independently of the users collection. The hot path stops carrying the cold history.
There's also the related anti-pattern of embedding an entire sub-resource you intend to paginate. If you'll ever say "show me page 3 of comments for this post," the comments don't belong embedded in the post. Pagination is a strong signal that the data wants its own collection.
Anti-pattern 2: Missing indexes (and the indexes you have being the wrong ones)
You can do everything else right and still bring an app to its knees with this one.
MongoDB will gladly let you scan an entire 50M-document collection on a single query. It won't refuse. It won't warn. It'll just do it. Slowly. While holding up everything else trying to read from the same node. Then the next request will do it again, because MongoDB doesn't cache query results. It caches data pages, which doesn't help much when the working set is 200GB.
The most reliable way to find missing indexes in an existing app is to actually look:
// Enable the profiler for slow queries on a database
db.setProfilingLevel(1, { slowms: 100 });

// Then later, ask what's been slow
db.system.profile
  .find({ millis: { $gte: 100 } })
  .sort({ ts: -1 })
  .limit(20)
  .pretty();
Atlas has a Performance Advisor that does basically the same job with a nicer UI, and it'll suggest indexes too. Either tool, the same pattern shows up over and over: a query on a field that has no index, on a collection that grew bigger than anyone expected.
But "missing index" is only half the problem. The trickier half is indexes that exist but don't match the query. Index design in MongoDB follows what's commonly called the ESR rule, which is one of those rules that sounds dry until you've debugged a slow query at 3am and realised this is why it's slow.
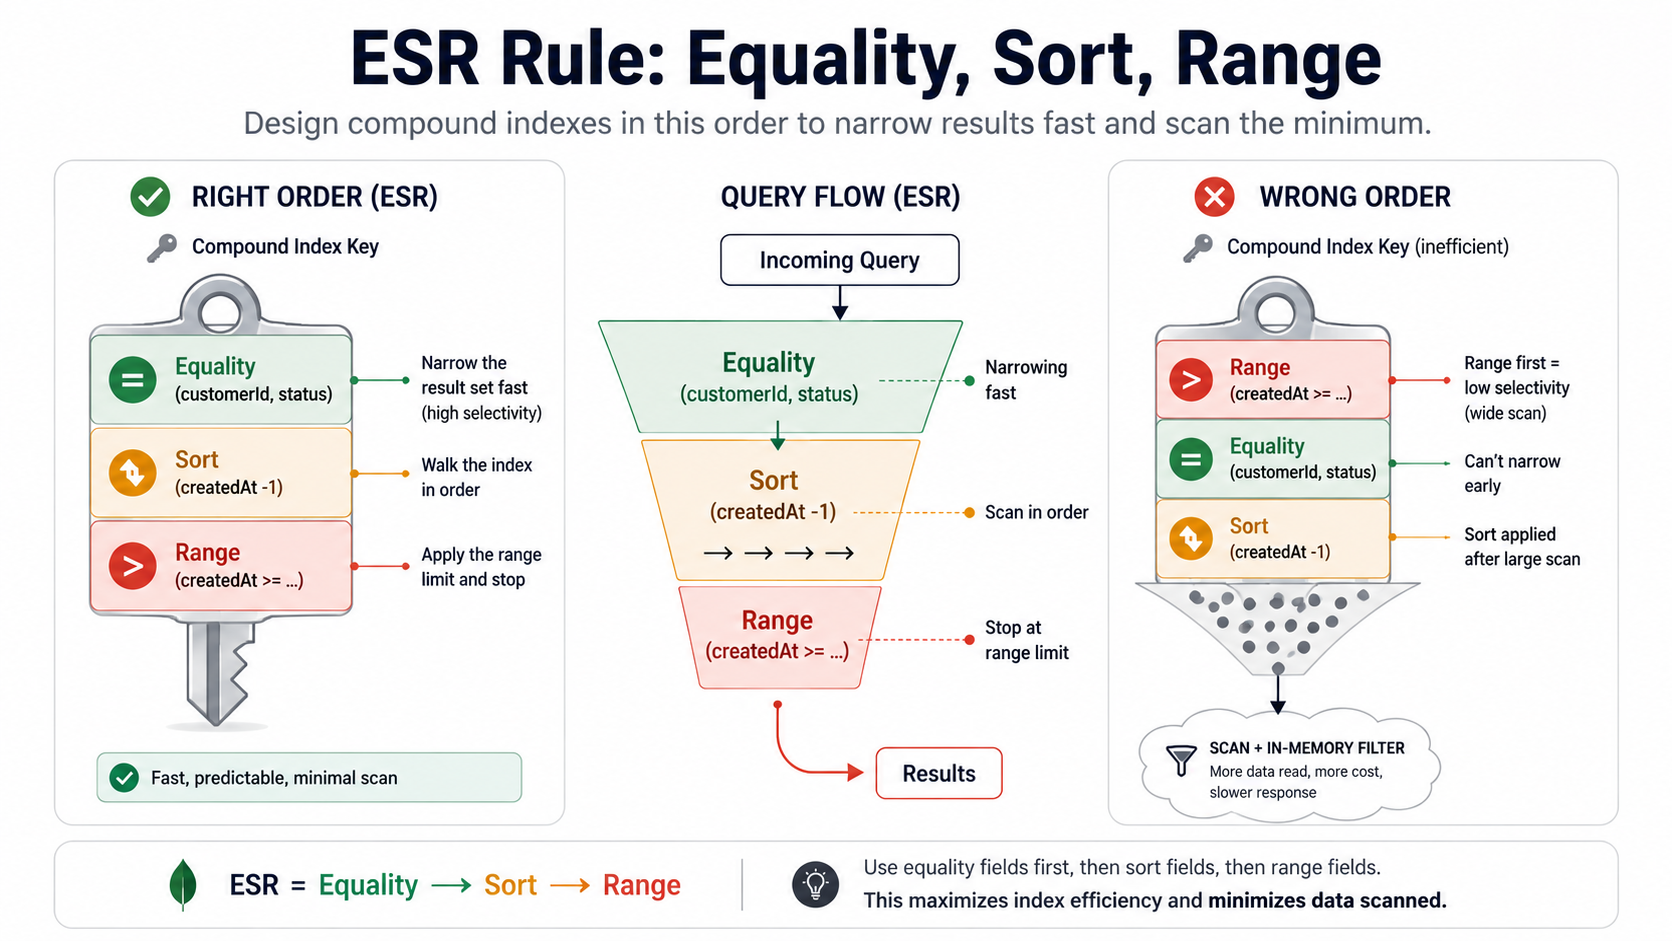
ESR: Equality, Sort, Range (in that order)
When you build a compound index, the field order matters, and the order that actually works is:
- Equality: fields you filter on with
=. - Sort: fields you sort by.
- Range: fields you filter on with
<,>,$gte,$lte,$inover many values.
Here's a query that you'd see in real life:
db.orders.find({
  customerId: ObjectId("..."),    // equality
  status: "paid",                  // equality
  createdAt: { $gte: lastMonth },  // range
})
.sort({ createdAt: -1 })           // sort
.limit(50);
The index that actually serves this query is:
db.orders.createIndex({
  customerId: 1,   // E
  status: 1,       // E
  createdAt: -1,   // S + R (same field, sort direction matters)
});
Not this:
// Looks reasonable, performs badly
db.orders.createIndex({
  createdAt: -1,
  customerId: 1,
  status: 1,
});
The wrong-order index can technically be used, but MongoDB has to scan a wide range slice first and filter the rest in memory. With the right-order index, it walks straight to the customer's paid orders sorted by date and stops at 50. Same query, same data, completely different cost.
To prove which one is being used, .explain("executionStats") is the only honest answer:
db.orders.find({
  customerId: ObjectId("..."),
  status: "paid",
  createdAt: { $gte: lastMonth },
})
.sort({ createdAt: -1 })
.limit(50)
.explain("executionStats");
The two numbers that matter are totalDocsExamined and totalKeysExamined. If totalDocsExamined is close to nReturned (say, 60 examined to return 50), the index is doing its job. If totalDocsExamined is much bigger than nReturned (say, 200,000 examined to return 50), MongoDB is doing post-filtering in memory and you've got the wrong index for this query.
The other missing-index trap: regex and case-insensitive search
// Looks fine. Is a full collection scan.
db.users.find({ email: /^ada@/i });
A case-insensitive regex can't use a normal text index. The i flag forces a scan. If you need this, either:
- Store a normalised lowercase copy of the field (
email_lower) and query that with an exact match, or - Build the index as a case-insensitive collation index:
db.users.createIndex({ email: 1 }, { collation: { locale: "en", strength: 2 } })and query with the same collation.
The general posture: measure first, index second, drop unused indexes third. Unused indexes are not free either: every write has to update every index on the collection, so an over-indexed write-heavy collection is its own performance problem. db.collection.aggregate([{ $indexStats: {} }]) shows how often each index is actually used. If accesses.ops is zero after a representative period, you're probably looking at dead weight.
Anti-pattern 3: Documents that quietly turned into JSON warehouses
The third one is more cultural than technical, and it's a slow-motion version of the first.
A document starts at 2KB. Reasonable. Then product asks for "just one more field". Then somebody embeds a snapshot of a related entity "for the audit trail". Then a feature flag adds five booleans. Then somebody embeds the previous three versions of the document inside the document, for history. Then somebody starts shoving a denormalised view of the user's last 50 transactions into the user, "to make the dashboard faster."
A year later, that document is 800KB. There are a hundred million of them. And the cost shows up everywhere: working set memory, read amplification, write amplification, network egress, replica lag, backup size, ETL cost, Atlas autoscaling kicking in for the wrong reason.
A good rule of thumb: the document should be the unit you fetch on the most common read. If you find yourself routinely projecting away three quarters of the fields, the document is wearing a coat that doesn't belong to it.
Some of the worst offenders:
const ProductSchema = new mongoose.Schema({
  sku: String,
  name: String,
  price: Number,

  // ❌ Audit history embedded inline — grows forever, rewrites on every change
  history: [
    {
      changedBy: String,
      changedAt: Date,
      before: mongoose.Schema.Types.Mixed,
      after: mongoose.Schema.Types.Mixed,
    },
  ],

  // ❌ Full denormalised copy of supplier data — duplicated, gets stale
  supplier: {
    id: mongoose.Schema.Types.ObjectId,
    name: String,
    contactEmail: String,
    address: { line1: String, city: String, country: String, zip: String },
    bankDetails: { iban: String, swift: String },
  },

  // ❌ All reviews ever, sorted descending, embedded for fast read
  reviews: [
    {
      userId: mongoose.Schema.Types.ObjectId,
      rating: Number,
      title: String,
      body: String,
      images: [String],
      createdAt: Date,
    },
  ],

  // ❌ Per-region pricing snapshots stored as a giant blob
  regionalSnapshots: mongoose.Schema.Types.Mixed,
});
Every section here is a separate anti-pattern in one schema:
historyis an unbounded array that grows forever and rewrites on every change. This is what change-streams or a dedicatedaudit_eventscollection are for.supplieris a full denormalised copy of another entity. Denormalisation is fine for display fields (name, country) you genuinely need on read. It's not fine for the entity's whole record, especially fields likebankDetailsthat absolutely should not be duplicated across millions of product documents for reasons that include both data integrity and basic security.reviewsis the embedded-pagination trap from anti-pattern 1, except worse because reviews can include images.regionalSnapshots: Mixedis the "I'll figure it out later" field that turns into the field nobody can refactor because nothing's typed.
How to keep documents honest
The fix isn't dramatic. It's just discipline applied early. A handful of habits that pay off:
const ProductSchema = new mongoose.Schema({
  sku: String,
  name: String,
  price: Number,
  // Display-only denormalised fields only. Not the whole supplier record.
  supplier: {
    id: { type: mongoose.Schema.Types.ObjectId, ref: "Supplier" },
    name: String,
    country: String,
  },
  reviewSummary: {
    averageRating: Number,
    reviewCount: Number,
  },
});
History lives in product_audit_events. Reviews live in product_reviews. The supplier's full record stays in suppliers and you $lookup (or, better, do a second targeted read in your application layer) when you need it. The product document fits on a screen.
Two MongoDB-specific tools help here:
- Schema validation. You can attach a JSON Schema to a collection that rejects writes that don't match. This isn't about turning Mongo into Postgres. It's about catching the moment someone adds a 17th optional field without thinking.
db.runCommand({ collMod: "products", validator: { $jsonSchema: {...} } }). Start withvalidationLevel: "moderate"so existing documents aren't rejected and only modified documents are validated against the new shape. - $bsonSize in aggregation. When you suspect a collection has bloated, this query is fast and brutal:
db.products.aggregate([
  { $project: { sku: 1, size: { $bsonSize: "$$ROOT" } } },
  { $sort: { size: -1 } },
  { $limit: 20 },
]);
That's the 20 fattest documents in the collection, in descending order. Run it on every collection you suspect once a quarter. The outliers are almost always interesting. They tell you which user, which product, which org has accidentally become the heaviest customer of your database, and that's almost always a bug.
The thread that runs through all three
If you squint at the three anti-patterns above, they're all the same anti-pattern wearing different clothes: letting growth happen in places you don't watch.
An unbounded array grows because nobody put a ceiling on it. A missing index becomes a problem because nobody watched the query plan as the collection grew. A document gets fat because nobody pushed back when somebody embedded "just one more thing."
The fix isn't to memorise a list of rules. It's to make the growth visible. Profile slow queries. Measure document size. Look at $indexStats quarterly. Bound every array, name the bound out loud, and if you can't name it, put the data in its own collection.
MongoDB is a really good database when you treat it like one, when you accept that it has a schema, that schema lives in your code, and that the cost of an extra field today is paid back many times over once the collection is ten million documents deep. Most of the production incidents you'll see aren't about MongoDB doing something surprising. They're about MongoDB doing exactly what you asked, on data that grew while nobody was looking.
Catch the patterns early, and the database keeps being boring. Which, when it comes to databases, is the highest compliment there is.