So it's Friday at 3pm and someone on the team types the word "deploy" in Slack. You feel it. The room gets quieter. People stop replying to messages. Eyes drift to Grafana. You ship the build, watch a few graphs, and refresh the status page like it's a slot machine. Half an hour later, when nothing's on fire, you exhale and pretend that wasn't terrifying.
That's the shape of a big-bang deploy. One environment, one running version, one switchover. Your entire user base meets your new code at the exact same moment, and if something's wrong they meet it together, loudly, in your inbox. Most outages you've read about postmortems for happen because of this exact pattern - a deploy that worked in staging hit production traffic and unraveled in ways nobody had a chance to spot until the dashboards already looked bad.
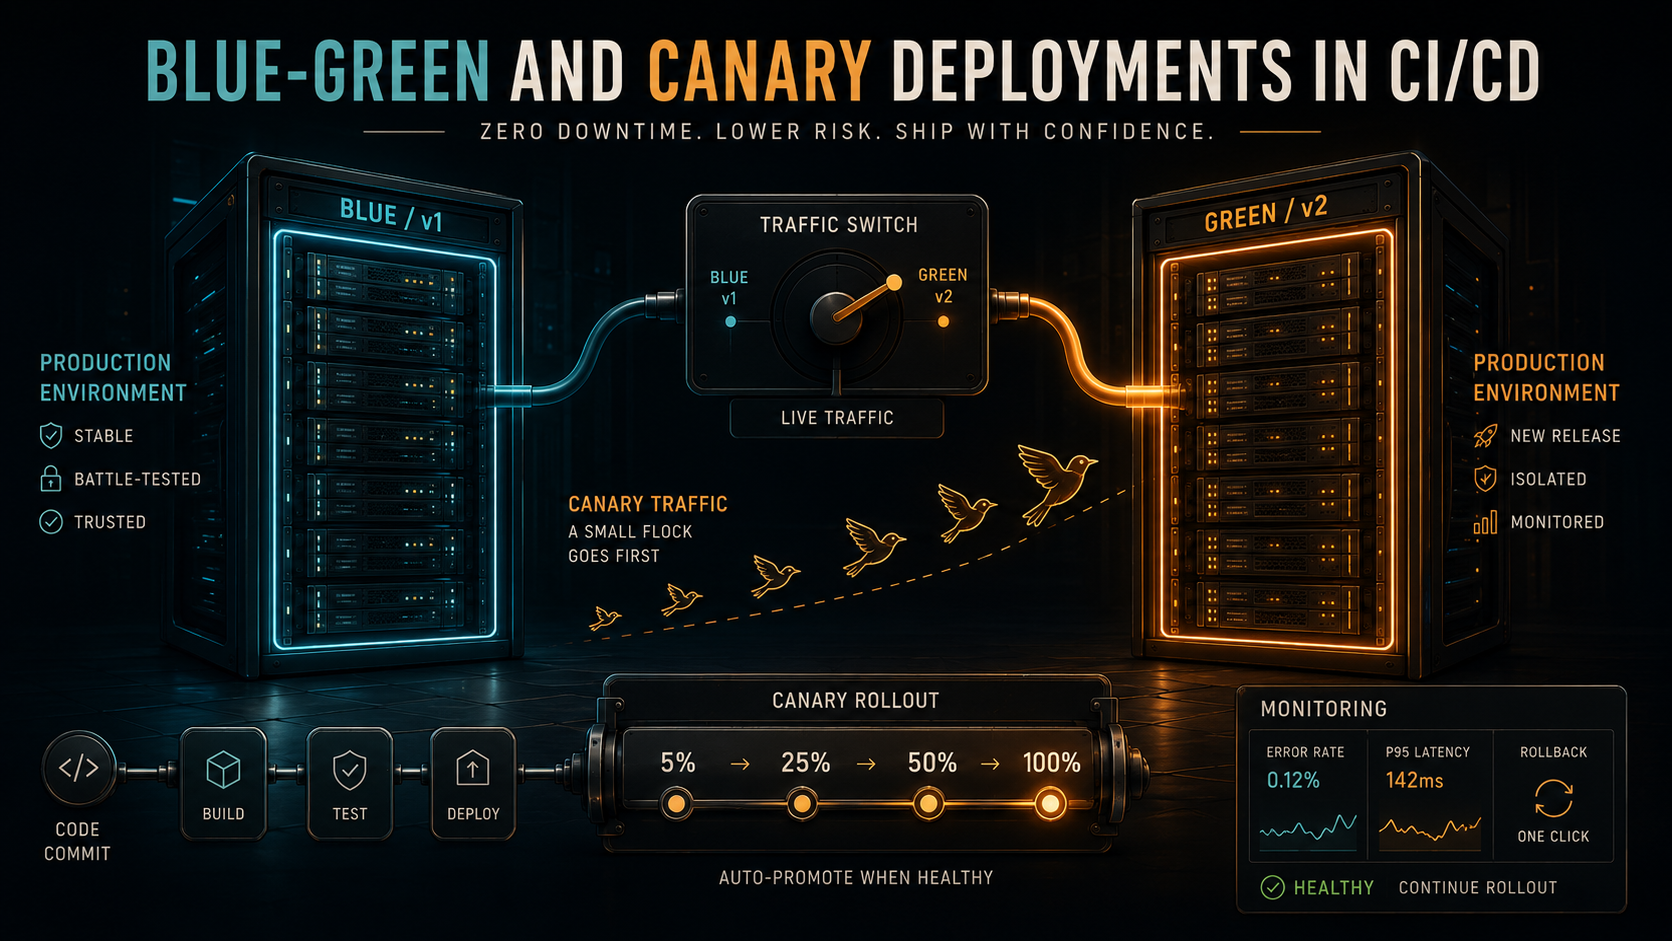
Blue-green and canary deployments exist to take that drama out. Not by making your code better - they don't fix bugs - but by making the act of deploying cheap, reversible, and observable. Once you've wired them into your CI/CD pipeline, "deploy" stops feeling like a moment and starts feeling like a process. That changes how often you ship, how brave you are about touching critical paths, and how much sleep you get on release days.
Let's walk through both, what each one is actually good at, and how to make them work in a real CI/CD setup without ending up with twice the infrastructure you can afford.
The Problem They're Both Solving
Before getting into the strategies, it's worth being precise about what a deploy actually risks.
A new version of your code can break in four broad ways. It can be straight-up broken - null pointer on startup, missing env var, container won't come up. It can be subtly broken - works for 90% of requests but throws on a specific shape of input that's rare in your test suite. It can be slow - passes every test but your p95 latency doubles under real traffic. Or it can be wrong in a way you can't see yet - the data it writes is slightly off, and you won't know until reports run tomorrow.
A naive deploy has the same response to all four: stop the old version, start the new one, hope. If something goes wrong, the rollback is "deploy the previous build again", which is itself a deploy, which means another window where the system is half this version and half that one.
What blue-green and canary buy you is the option to keep the old version running. Both strategies are really about routing traffic, not about deploying code. The deploy is the easy part. The interesting decision is which users get to meet your new code, and how fast you can take it back if you don't like what you see.
Blue-Green: Two Identical Stages
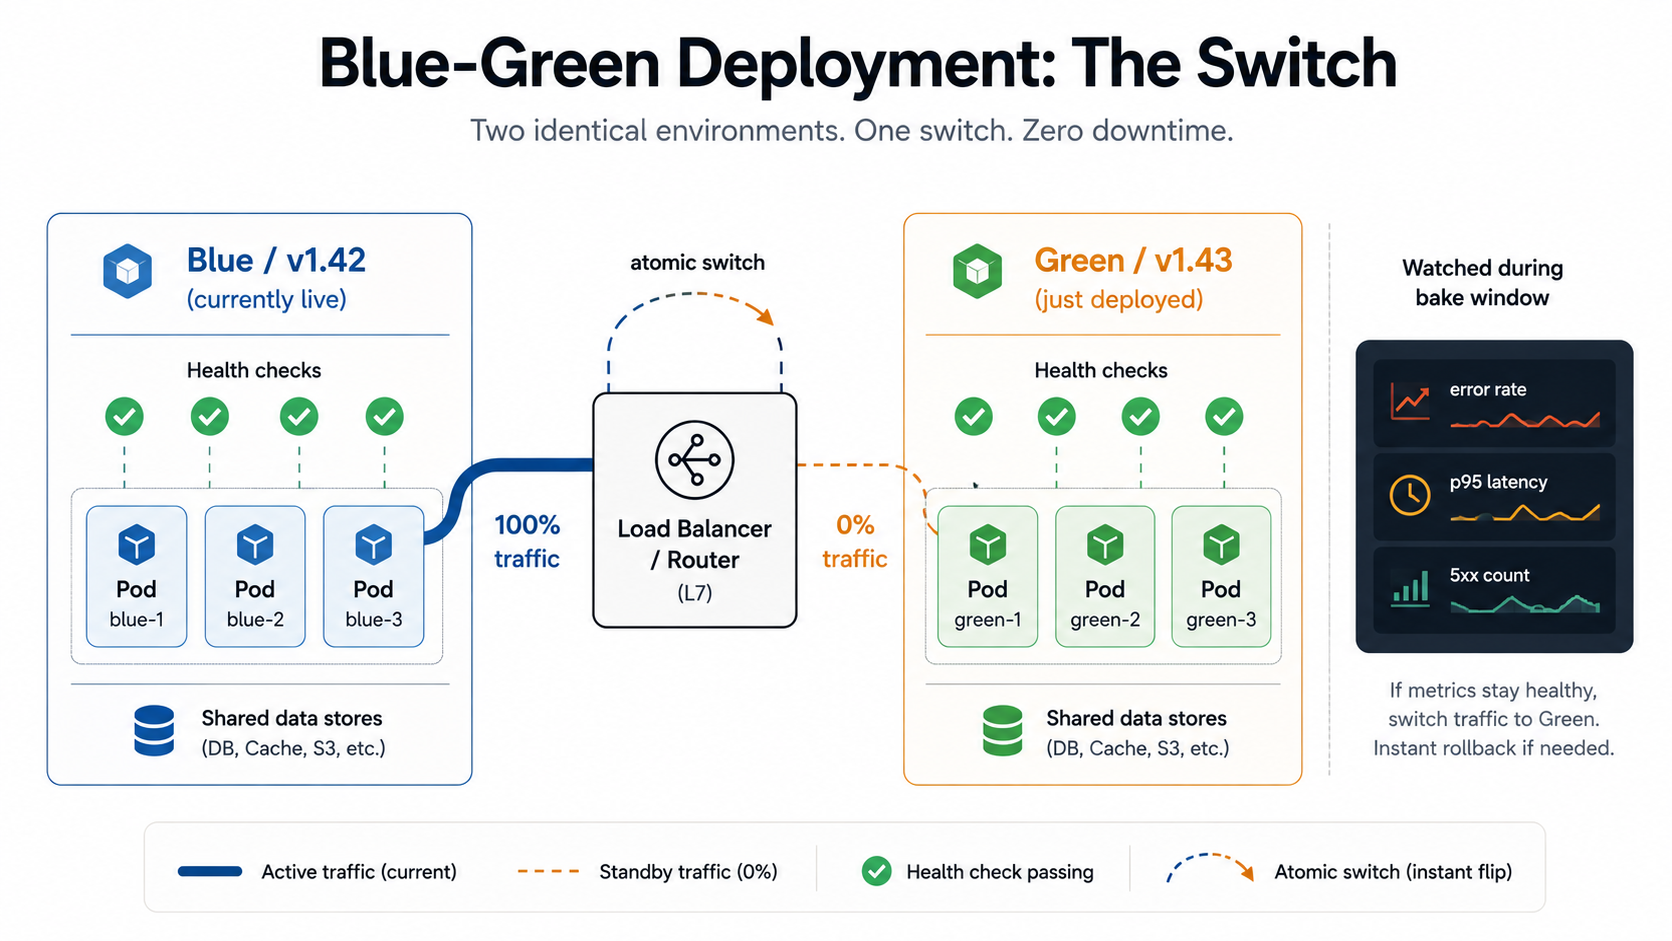
The blue-green idea is almost embarrassingly simple. You run two complete production environments side by side. One is live and serving all your traffic - let's call that blue. The other is idle, or close to idle - that's green. When you want to deploy a new version, you push it to green, run smoke tests against it, and only when you're happy you flip the load balancer so all traffic goes to green instead of blue. Blue is now your hot standby. If green misbehaves, you flip back.
The whole strategy lives in two operations:
1. Deploy v2 to the idle stage (green)
2. Health check + smoke test the idle stage
3. Switch the router so 100% of traffic now points at green
4. Keep blue running, idle but warm, for a defined window
5. If anything breaks, switch back to blue
The thing that makes this cheap operationally is that the switch is atomic. From the user's point of view, one request hits v1 and the next request hits v2. There's no window where some users are on v1 and some are on v2 - at least not for long. Compare that to a rolling deploy where you're spending five or ten minutes with a fleet that's half new, half old, and you can see why blue-green appeals when "mixed versions in flight" is a problem for you (most commonly: when a request might touch a queue or a database in a way that the two versions disagree about).
The thing that makes this expensive is also right there: you're running two full environments. For something stateless and containerized that's fine - spinning up a parallel green stack costs a few minutes of compute. For a stateful monolith with a 200GB cache that takes an hour to warm, it's a different conversation.
A simple Kubernetes-style blue-green setup looks roughly like this. You keep two deployments and one service, and you flip the service's selector to point at the version you want:
apiVersion: apps/v1
kind: Deployment
metadata:
  name: api-blue
spec:
  replicas: 6
  selector:
    matchLabels:
      app: api
      slot: blue
  template:
    metadata:
      labels:
        app: api
        slot: blue
        version: v1.42.0
    spec:
      containers:
        - name: api
          image: registry.example.com/api:v1.42.0
          readinessProbe:
            httpGet: { path: /healthz, port: 8080 }
            initialDelaySeconds: 5
            periodSeconds: 5
---
apiVersion: apps/v1
kind: Deployment
metadata:
  name: api-green
spec:
  replicas: 6
  selector:
    matchLabels:
      app: api
      slot: green
  template:
    metadata:
      labels:
        app: api
        slot: green
        version: v1.43.0
    spec:
      containers:
        - name: api
          image: registry.example.com/api:v1.43.0
          readinessProbe:
            httpGet: { path: /healthz, port: 8080 }
            initialDelaySeconds: 5
            periodSeconds: 5
---
apiVersion: v1
kind: Service
metadata:
  name: api
spec:
  selector:
    app: api
    slot: blue   # <-- the switch lives here
  ports:
    - port: 80
      targetPort: 8080
Promoting green is a one-line change: patch the service's slot selector from blue to green. Roll back? Patch it back. Your CI/CD job is essentially a kubectl patch plus a polling loop on readiness and a smoke test against the public URL.
On AWS, you get the same shape with two target groups behind an Application Load Balancer; promotion is a ModifyListener call that changes which target group the listener forwards to. CodeDeploy has a managed blue-green mode that wraps this up for you, including a configurable bake time before the old environment is torn down. On Vercel and most edge platforms, every preview deployment is effectively a green stack with its own URL - promoting to production is the platform's name for the load-balancer flip.
The trade-off is real. Blue-green is binary. You either trust the new version with 100% of production traffic or you trust it with 0%. Smoke tests against an isolated green environment will catch the worst stuff, but they won't catch the bug that only shows up under your actual traffic mix. The moment you flip the switch, every user is on v2. That's where canary comes in.
Canary: Letting A Few Users Vote First
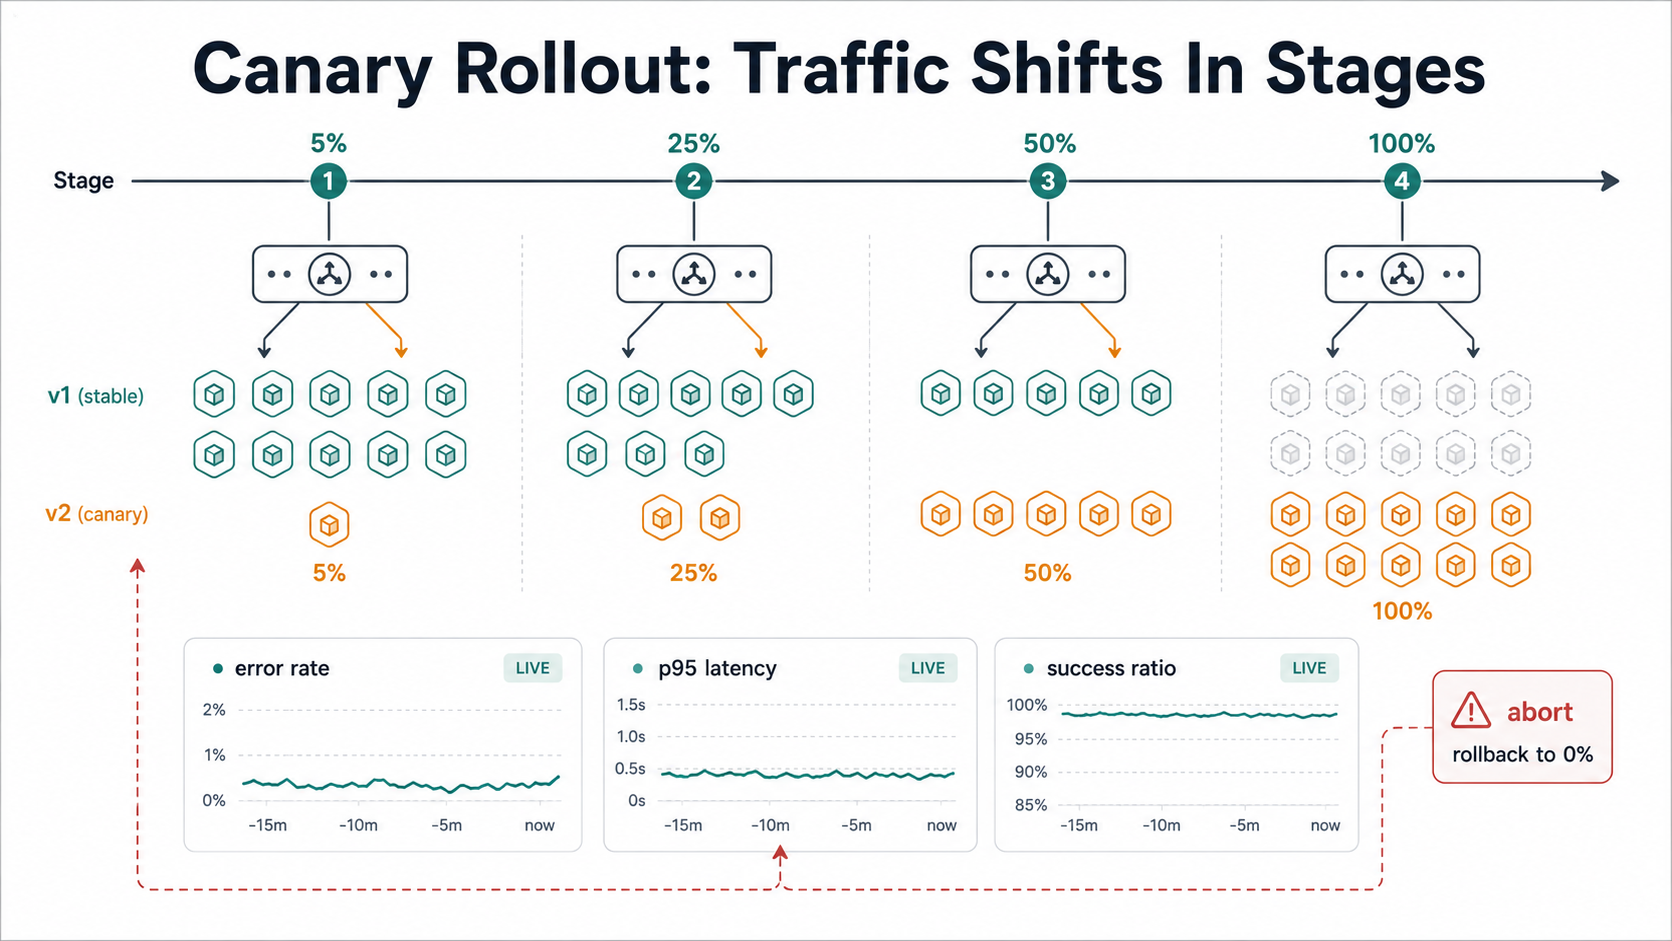
The canary strategy keeps both versions in production at the same time and gradually shifts traffic from old to new. You start by routing, say, 5% of requests to the new version. You watch your metrics. If error rates stay flat and latency looks normal, you bump it to 25%, then 50%, then 100%. If anything looks off at any stage, you stop and roll back to 0%.
The name is morbid but the idea isn't. Canary deploys treat your real users - a small, randomly chosen slice of them - as the most accurate possible staging environment. Because they are. No synthetic load test will reproduce the exact distribution of traffic shapes, payload sizes, browser quirks, and edge cases that your actual production traffic produces. A 5% canary running for ten minutes will surface bugs that two days of staging tests will miss.
The progressive rollout typically looks like this:
v2 deployed alongside v1
  5%  traffic → v2   [observe 10 min - error rate, latency, business metrics]
  25% traffic → v2   [observe 10 min]
  50% traffic → v2   [observe 10 min]
 100% traffic → v2   [v1 drained and removed]
Where blue-green's hard decision was "do we cut the cord?", canary's hard decision is "do we promote to the next stage?". And that decision can - and should - be automatic. Tools like Argo Rollouts, Flagger, Spinnaker, AWS CodeDeploy's canary mode, and Istio's traffic-shifting primitives will compare metrics from the canary pods to the stable pods at each step and abort the promotion if they look meaningfully worse.
Here's roughly what a Flagger-managed canary looks like on top of Kubernetes - you declare the target deployment, the traffic steps, and the metrics the rollout should monitor at each step:
apiVersion: flagger.app/v1beta1
kind: Canary
metadata:
  name: api
spec:
  targetRef:
    apiVersion: apps/v1
    kind: Deployment
    name: api
  service:
    port: 80
    targetPort: 8080
  analysis:
    interval: 1m
    threshold: 5            # rollback after 5 failed checks
    stepWeight: 20          # promote in 20% increments
    maxWeight: 100
    metrics:
      - name: request-success-rate
        thresholdRange:
          min: 99
        interval: 1m
      - name: request-duration
        thresholdRange:
          max: 500          # p99 latency in ms
        interval: 1m
    webhooks:
      - name: smoke-test
        url: http://flagger-loadtester.test/
        timeout: 30s
        metadata:
          cmd: "curl -sS http://api-canary/healthz"
The controller does the boring work: at each interval it scrapes the success rate and latency from your service mesh or your metrics backend, compares the canary's numbers to the stable's numbers, and either advances the weight or rolls back. You don't need an engineer watching dashboards at 2am - you need accurate enough metrics that the controller can make the call.
The thing canary asks of you that blue-green doesn't is good telemetry. If you can't tell from your metrics whether the 5% canary is healthier than the 95% stable, you can't make the decision to promote. That's why teams that adopt canary deployments often end up improving their observability stack at the same time - you need per-version dashboards, you need to tag traces with the version label, and you need at least one or two business-level metrics that change when the user experience actually breaks (checkout completion rate, login success rate, search-to-click ratio).
The other thing canary asks of you is that your two versions can run side by side without stepping on each other. This is mostly a database story. If v2 reads a new column that v1 doesn't know about, v1 must be tolerant - it just ignores the new column. If v2 writes a new column that v1 needs to read, you need to deploy the schema change first as a forward-compatible migration, before either version goes out. The general rule is that schema changes are deployed in a pass that both versions can tolerate, and the column or table is finally used once the version that needs it is fully rolled out. That's the expand-and-contract pattern, and it's where most canary horror stories start when teams skip it.
Pick Blue-Green Or Canary?
It's tempting to say canary is "better" - it strictly subsumes the binary blue-green flip, you might think - but in practice they suit different things, and a lot of mature teams use both depending on the release.
Blue-green wins when:
- You can't easily run two versions side by side because of state, mixed-version semantics, or message ordering. Stateful services, event consumers reading from a shared queue, batch jobs.
- The new version is risky enough that you want the rollback path to be a single switch you can hit in under a second.
- Your traffic is bursty and 5% of "off-peak" can be a tiny number of requests that doesn't tell you anything useful.
- You're shipping a database migration that requires the old version to be drained completely before the new one takes over.
Canary wins when:
- Your service is stateless or your state is well-isolated.
- You have decent observability and at least one strong business metric that moves with user pain.
- The change is a candidate for partial problems - performance regressions, edge-case bugs, increased error rate on specific request types - rather than a binary "works / doesn't work".
- You ship often. Canary has a per-deploy cost (observation time at each step), but it scales beautifully if you're deploying multiple times a day.
A common pattern in larger orgs is blue-green at the cluster level, canary at the pod level inside the green cluster. The cluster swap is your nuclear rollback option; the in-cluster canary is your day-to-day. You don't have to pick.
What This Looks Like In CI/CD
The strategies are mostly orchestration. Your CI/CD job stops being "build, push, replace" and becomes "build, push, route". Here's what each stage tends to need.
A GitHub Actions workflow that ships a blue-green deploy might look like this. The interesting moves are after the image push - you're updating the idle environment, running checks against it, then patching the selector that routes traffic. The deploy command is a single declarative change.
name: Deploy (blue-green)

on:
  push:
    branches: [main]

jobs:
  release:
    runs-on: ubuntu-latest
    permissions:
      contents: read
      id-token: write   # OIDC into your cloud
    steps:
      - uses: actions/checkout@v4

      - name: Build and push image
        run: |
          docker build -t $REGISTRY/api:${{ github.sha }} .
          docker push $REGISTRY/api:${{ github.sha }}

      - name: Determine idle slot
        id: slot
        run: |
          current=$(kubectl get svc api -o jsonpath='{.spec.selector.slot}')
          idle=$([ "$current" = "blue" ] && echo "green" || echo "blue")
          echo "idle=$idle" >> "$GITHUB_OUTPUT"

      - name: Deploy to idle slot
        run: |
          kubectl set image deployment/api-${{ steps.slot.outputs.idle }} \
            api=$REGISTRY/api:${{ github.sha }}
          kubectl rollout status deployment/api-${{ steps.slot.outputs.idle }} --timeout=5m

      - name: Smoke test idle slot
        run: ./scripts/smoke-test.sh https://api-${{ steps.slot.outputs.idle }}.internal

      - name: Promote idle slot to live
        run: |
          kubectl patch svc api -p \
            '{"spec":{"selector":{"app":"api","slot":"${{ steps.slot.outputs.idle }}"}}}'

      - name: Bake (keep old slot warm)
        run: sleep 600   # 10 min - keep the old slot ready to flip back to
A canary version on GitLab CI looks structurally different because the rollout itself is staged. You don't promote in one job; you let a controller (or a series of manual gates) walk through the percentages. With Argo Rollouts or Flagger, the CI job's responsibility is just to update the deployment and let the controller do the rest:
stages:
  - build
  - deploy
  - verify

build:
  stage: build
  script:
    - docker build -t $CI_REGISTRY_IMAGE:$CI_COMMIT_SHA .
    - docker push $CI_REGISTRY_IMAGE:$CI_COMMIT_SHA

deploy_canary:
  stage: deploy
  script:
    - kubectl set image deployment/api api=$CI_REGISTRY_IMAGE:$CI_COMMIT_SHA
    # Flagger picks this up and starts the staged rollout automatically.
  environment:
    name: production
    deployment_tier: production

verify_rollout:
  stage: verify
  script:
    - ./scripts/wait-for-rollout.sh api 30m
    # Polls the Canary CRD's status. Exits 0 if Succeeded, non-zero if Failed.
  needs: [deploy_canary]
The shape is the same on Jenkins. If you're more comfortable scripting it explicitly - say you don't want to add a service mesh - you can do a hand-rolled canary with two deployments and a weighted service or ingress. Jenkins or any pipeline tool can step through the weights:
pipeline {
  agent any
  stages {
    stage('Build') { steps { sh 'docker build -t api:${BUILD_NUMBER} . && docker push api:${BUILD_NUMBER}' } }
    stage('Deploy canary at 5%') {
      steps {
        sh 'kubectl set image deployment/api-canary api=api:${BUILD_NUMBER}'
        sh 'kubectl rollout status deployment/api-canary --timeout=5m'
        sh './scripts/set-traffic-weight.sh api-canary 5'
        sh './scripts/observe.sh api-canary 600'   // 10 min watch
      }
    }
    stage('Promote to 25%')  { steps { sh './scripts/set-traffic-weight.sh api-canary 25'  ; sh './scripts/observe.sh api-canary 600' } }
    stage('Promote to 50%')  { steps { sh './scripts/set-traffic-weight.sh api-canary 50'  ; sh './scripts/observe.sh api-canary 600' } }
    stage('Promote to 100%') { steps { sh './scripts/set-traffic-weight.sh api-canary 100' ; sh './scripts/observe.sh api-canary 600' } }
    stage('Cleanup old version') {
      steps { sh 'kubectl set image deployment/api-stable api=api:${BUILD_NUMBER}' }
    }
  }
  post {
    failure { sh './scripts/set-traffic-weight.sh api-canary 0' }   // rollback
  }
}
The observe.sh script in those examples is the thing you actually have to write thoughtfully - more on that in the next section.
What To Watch During The Rollout
This is the part teams under-invest in and then regret. The whole value of blue-green and canary comes from the ability to catch a bad deploy before it's everyone's problem. If you can't catch it, you've spent a lot of operational complexity for not much benefit.
A useful observation window watches three layers at once.
The first layer is infrastructure health. Are the new pods passing readiness probes? Are they restarting? Is memory creeping up? CPU? This is the cheap part, and you should refuse to advance the rollout if any of these look wrong. Most platforms give you this for free - Kubernetes will mark a deployment as failed if pods can't become ready, and your CI job can read that status.
The second layer is request-level metrics. Error rate, p50 / p95 / p99 latency, request rate. The trick is to compare the canary version's numbers to the stable version's numbers in the same time window, not to historical baselines. If both versions show a 5% error spike at the same moment, it's an upstream incident, not your deploy. Tag your metrics with the version (most service meshes do this automatically) so the comparison is mechanical.
The third layer is business metrics. This is the layer that's easy to skip and is also the one that catches the deploys infrastructure metrics miss. The new build has a perfect 200 response rate but the response is wrong - the checkout button quietly stopped firing the conversion event, signups are flat, search returns an empty array but with a 200. You want at least one or two business-level counters in your rollout decision loop. They don't need to be elaborate; checkout-completed-per-minute on the canary versus the stable is enough to catch a surprisingly large class of bugs.
A pragmatic minimum observation script does something like this. The numbers are illustrative - you'll tune the thresholds to your service:
#!/usr/bin/env bash
set -euo pipefail
service=$1
duration=${2:-600}
end=$(( $(date +%s) + duration ))

while [ "$(date +%s)" -lt "$end" ]; do
  err_canary=$(curl -s "$PROM/api/v1/query?query=sum(rate(http_requests_total{service='$service',version='canary',status=~'5..'}[1m]))" | jq -r '.data.result[0].value[1] // "0"')
  err_stable=$(curl -s "$PROM/api/v1/query?query=sum(rate(http_requests_total{service='$service',version='stable',status=~'5..'}[1m]))" | jq -r '.data.result[0].value[1] // "0"')

  if awk -v c="$err_canary" -v s="$err_stable" 'BEGIN { exit !(c > s * 2 && c > 0.1) }'; then
    echo "Canary error rate ($err_canary/s) is more than 2x stable ($err_stable/s) - aborting"
    exit 1
  fi
  sleep 15
done
echo "Canary clean for ${duration}s - ready to advance"
Two things to note. First: the window matters. Ten minutes is a common starting point and is enough to catch most acute regressions, but slow-burning issues (a memory leak, a connection-pool exhaustion) can take longer to show up - bake longer for changes you suspect will exercise long-running paths. Second: be careful with low-traffic windows. A 5% canary in the middle of the night might only see a handful of requests, and a single 500 will skew your error-rate ratio absurdly. Either weight your decisions by request volume or schedule risky deploys during a window where 5% is statistically meaningful.
Rolling Back Without Drama
Both strategies make rollback structurally cheap, but only if you build the rollback path first.
For blue-green, the rollback is the same operation as the promotion in reverse. Patch the service selector back to the old slot. If your CI/CD has a one-click "revert this deploy" button, this is what it should call. Keep the old slot warm - running, healthy, ready to take traffic - for at least one observation window after promotion. Cost-conscious teams often scale the old slot's replicas down to a minimum after the switch instead of tearing it down; you save compute without losing the snap-back.
For canary, rollback means setting the canary's weight back to 0 and stopping the promotion. Argo Rollouts and Flagger do this automatically when their analysis runs fail. If you're rolling your own, your pipeline's failure handler should set the weight to 0 before it does anything else - definitely before it logs the failure to Slack or pages someone. Every second of bad traffic is users having a bad time.
The trap to watch for in either case is state. Code rolls back cleanly. Data doesn't always. If v2 wrote a new column, removed an old one, or shipped a message format that v1 can't parse, a rollback puts your system in a state where the running code doesn't match the data shape. This is the part that ruins rollbacks and the reason the expand-and-contract migration pattern exists: every schema change is split into two deploys, with the in-between state being one that both versions can read.
If you remember nothing else from this section, remember this: a rollback is a code change, not a code revert. Treat it like a deploy. It can fail. It needs the same checks. And your data migrations need to be designed so that going backwards is always safe.
The Subtle Pitfalls
A few things that are easy to miss until they bite you.
Sticky sessions are a canary tax. If your load balancer pins a user to a backend based on a cookie, a 5% canary doesn't mean 5% of requests - it means roughly 5% of sessions, and once a user gets pinned to a canary backend they stay there for the duration of their session. That can be what you want, but if you're trying to compare error rates between cohorts, the cohorts are now session-shaped, not request-shaped, and your statistical assumptions need to adjust.
Cold caches lie. A freshly deployed pod has empty in-memory caches, a cold connection pool, and a JVM/Node runtime that hasn't been JIT'd to the same shape as the long-running stable pod. For the first minute or two, the canary will look slower than the stable. If you're not careful, your rollout controller reads this as a regression and rolls back. Most controllers let you configure a startup grace period - use it.
Feature flags and version flips do different jobs. If you can ship a change behind a feature flag, that's almost always cheaper than a canary deploy, because you can toggle it for individual users without redeploying anything. Use flags for "is this feature on for this user?" and use canary for "is this version of the code safe for any user?". Mixing them up is fine when the change is small; for risky migrations or framework upgrades, you really do want both.
Database connection counts double during the switch. If both versions are running at full replica count, you're holding twice as many DB connections as usual. Most teams find out about this when their Postgres max_connections runs out mid-promotion. Either reduce replicas on the idle slot during the bake window, or use a connection pooler in front of the DB so the deployment doesn't care.
Deploys aren't free even when they succeed. Every promotion has an opportunity cost: someone is watching it, the team is on heightened alert, an incident in another area is harder to triage because half the dashboards are showing a deploy spike. A team that runs ten canary deploys a day has good tooling; a team that runs ten blue-green deploys a day is exhausted. Pick the strategy that matches your release cadence.
When You Don't Need Either
It's worth saying: both of these are operational investments, and not every service needs them. An internal admin tool used by four people during business hours is fine on a rolling deploy or a brief maintenance window. A read-only marketing site you redeploy with a static export doesn't need either strategy. A scheduled batch job that runs at 3am can just stop, get the new code, and start.
The services that earn the complexity are the ones where downtime is expensive and where bad deploys are catastrophic - your customer-facing API, your auth service, your payment path, your message ingestion pipeline. For those, the cost of one bad afternoon is higher than the cost of a year of pipeline complexity.
Start by picking the one service where you've felt the pain. Wire blue-green into its pipeline first - it's simpler, the rollback is more dramatic, and you'll learn what observability you're missing. Once that's normal, move that same service to a canary rollout to get more granular safety, and bring the lessons (especially the metrics you wished you'd had) to the next service.
Done well, deploying becomes the dullest part of your week, which is exactly how it should feel. Friday at 3pm should feel like Tuesday at 11am. The deploy is just the moment the new code starts handling a fraction of your users, and the dashboards say it's fine, and you go back to whatever you were doing before.