You've watched the green checkmark.
But you've also watched the spinner. The one that turns for twenty-two minutes on every pull request, the one that makes everyone on the team open Slack while they wait, the one that you've slowly stopped noticing because what else are you going to do? CI is just slow. That's CI.
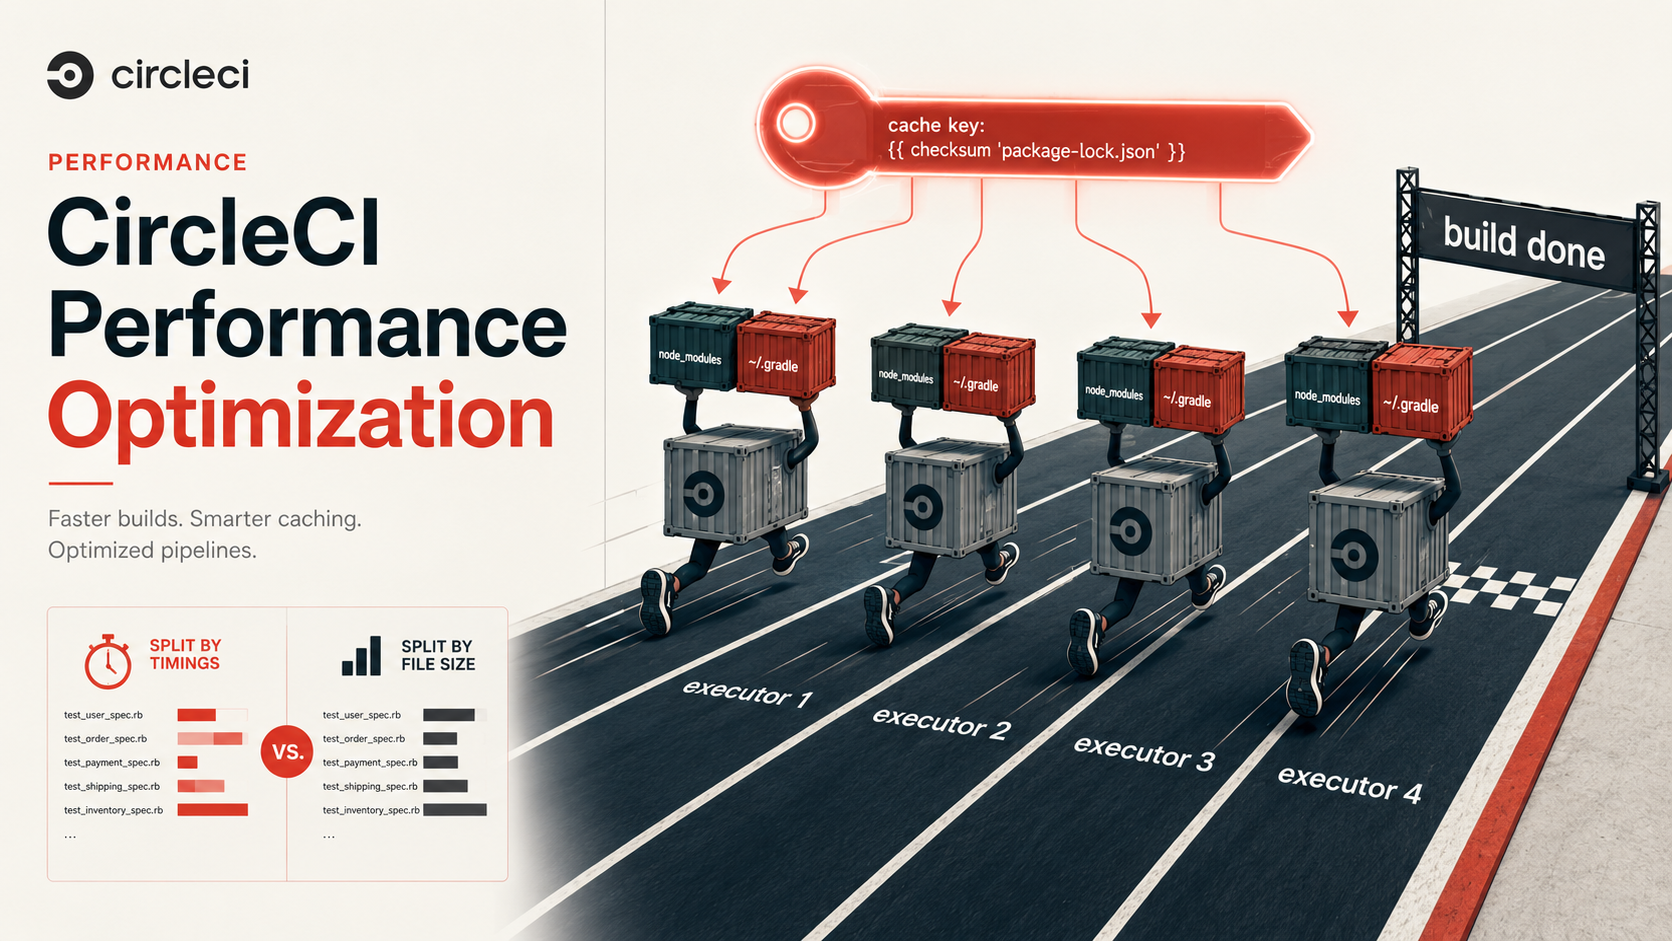
Here's the thing, most CircleCI pipelines that take twenty-two minutes could take six. Not because the work itself is faster, but because the same work gets done over and over again on every run, in serial, on a single executor, with no cache, when the platform you're paying for has three different knobs that would each cut a chunk out of the wall-clock time. Cache keys, parallelism, and test splitting. That's almost the whole game.
This is a deep tour through those three. Not because they're the only things that matter, resource classes, Docker layer caching, workspaces, and conditional workflows all have roles, but because if you only learn three things about CircleCI, those are the ones that pay back the most. Let's break it down.
The mental model: where your CI minutes actually go
Before you optimize anything, you need to know what you're optimizing. Open a recent build and look at the job timeline. Almost every CircleCI job that feels slow is slow for one of these reasons, in this order of frequency:
- You're reinstalling dependencies on every run.
npm install,composer install,bundle install,pip install,go mod download, each one of these has a "first time on this machine" cost and a "subsequent runs" cost, and without caching, every CircleCI job is a "first time". - You're doing slow work on one machine that could be done on five. A test suite is the canonical example, but linters, build artifacts, integration suites, type-checkers, anything that fans out cleanly is sitting on a single CPU when it doesn't have to be.
- You're splitting work in a way that makes one machine the bottleneck. This is the second-order trap: you turned on parallelism, but one of your four executors got all the slow tests and the other three finished in two minutes and sat idle for fourteen.
- You're rebuilding the same thing every job in a workflow. Build the binary in
build, rebuild it intest, rebuild it again indeploy. Workspaces fix this; many pipelines don't use them. - You're running the wrong executor for the work. A
smallresource class executing a Go build with 500 packages. A2xlargerunning a 5-line shell script.
The four-minute version of the pipeline addresses 1, 2, and 3. That's what this article is about. Let's start with the one that has the biggest upside-to-effort ratio: caching done right.
Cache keys: the part everyone gets ninety percent right
CircleCI's cache is a per-project, key-addressed blob store. You write the right files into it with save_cache, you pull them back out with restore_cache, and the key is the bit that decides whether your job gets a fast warm start or a slow cold one. The shape is unsurprising:
- restore_cache:
    keys:
      - v1-deps-{{ checksum "package-lock.json" }}
      - v1-deps-
- run: npm ci
- save_cache:
    key: v1-deps-{{ checksum "package-lock.json" }}
    paths:
      - ~/.npm
      - node_modules
That looks right. It mostly is right. But the difference between "mostly right" and "right" is what turns a four-minute install into a fifteen-second restore. Three things matter, and most pipelines I've read miss at least one.
Pin the key tightly to what actually changed
The key is a template string. Whatever you template into it becomes part of the cache identity. {{ checksum "package-lock.json" }} says "if the lockfile is byte-for-byte the same, this cache is valid". That's good. But what about:
- A different OS image upgrade that broke a native module? Same lockfile, same key, wrong cache.
- A team member who runs
npm installinstead ofnpm ciand modifiespackage-lock.jsonin a way that's semantically a no-op? Different key, cold rebuild. - Two projects in the same CircleCI org sharing keys because the namespace is too loose? Cross-pollination.
The fix is to compose the key out of every input that meaningfully changes the output:
- restore_cache:
keys:
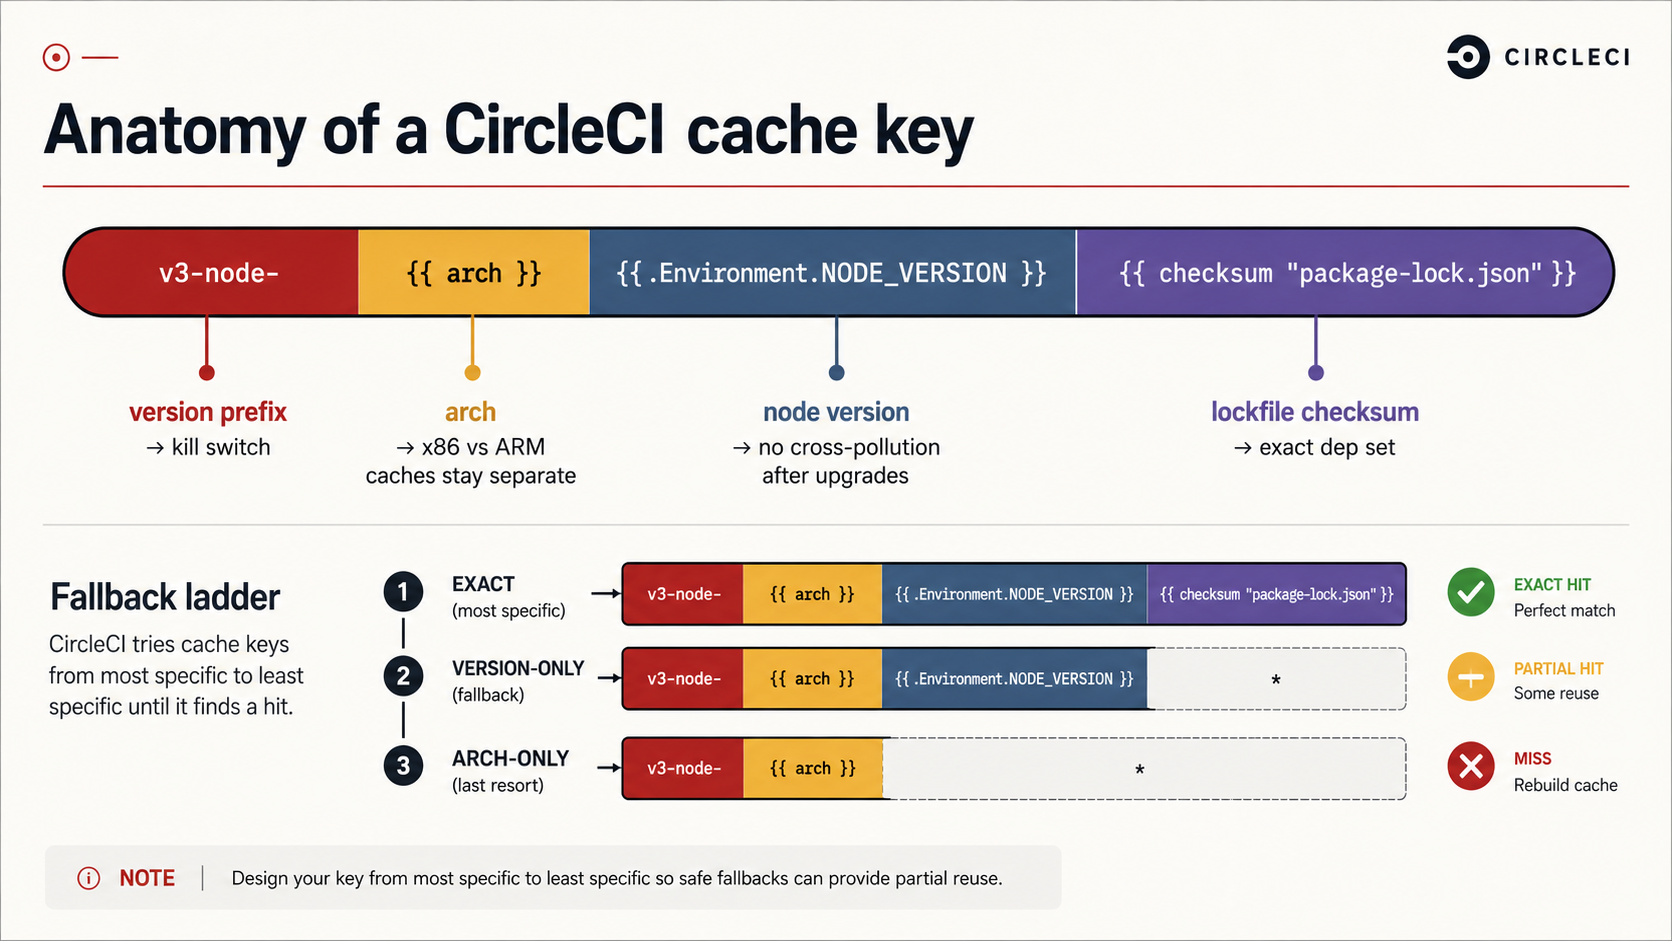
- v3-node-{{ arch }}-{{ .Environment.NODE_VERSION }}-{{ checksum "package-lock.json" }}
- v3-node-{{ arch }}-{{ .Environment.NODE_VERSION }}-{{ arch }} is the architecture of the executor, {{ .Environment.NODE_VERSION }} is whatever you've set as the Node version. Adding the v3- prefix at the front gives you a kill switch: bump it when you want to invalidate every cache without changing any inputs (CI flakes due to corrupted cache happen, and being able to bust without surgery is worth the four characters).
Use the fallback key list, but understand what "partial" means
The keys list is tried top to bottom. The first key that exists wins. That's how you get a partial-hit pattern:
- restore_cache:
    keys:
      - v3-node-{{ arch }}-{{ .Environment.NODE_VERSION }}-{{ checksum "package-lock.json" }}
      - v3-node-{{ arch }}-{{ .Environment.NODE_VERSION }}-
      - v3-node-{{ arch }}-
The first key is exact. If the lockfile changed by one line, the second key matches the most recent cache for this Node version on this arch, your job gets ninety-five percent of its node_modules warm, and npm ci only has to reconcile the diff. The third key is the broadest fallback, used after a Node bump.
Here's the catch most teams miss: npm ci does not respect a partial restore the way npm install does. npm ci is designed to wipe node_modules and rebuild it from scratch to match the lockfile exactly. If you want partial caches to actually help, you either use npm install (which is fine for CI when the lockfile is authoritative) or you cache ~/.npm (the package cache) instead of (or in addition to) node_modules, because npm ci will pull from ~/.npm to avoid network downloads. Same principle in other ecosystems: pip uses ~/.cache/pip, gradle uses ~/.gradle/caches, composer uses ~/.composer/cache. The artifact cache (your installed deps) and the download cache (the package manager's own cache) are different beasts, and the second one is usually the one that gives you the biggest speedup with the least risk of staleness.
Save the cache once per key, not on every job
save_cache is idempotent on the key. If a key already exists, a second save_cache to that key is a no-op, CircleCI will not overwrite it. That's usually what you want (the cache is supposed to be deterministic given the inputs), but it has a subtle implication: if you have ten jobs in your workflow that all do npm ci, you can save the cache from the first one and every subsequent job will benefit. You don't need to repeat the save step everywhere. Bundle dependency setup into one early job and have the rest restore-only.
In practice, that looks like a dedicated prepare job:
jobs:
  prepare:
    docker:
      - image: cimg/node:20.11
    steps:
      - checkout
      - restore_cache:
          keys:
            - v3-node-{{ arch }}-{{ checksum "package-lock.json" }}
            - v3-node-{{ arch }}-
      - run: npm ci
      - save_cache:
          key: v3-node-{{ arch }}-{{ checksum "package-lock.json" }}
          paths:
            - ~/.npm
            - node_modules
      - persist_to_workspace:
          root: .
          paths:
            - node_modules
            - dist

  test:
    docker:
      - image: cimg/node:20.11
    steps:
      - checkout
      - attach_workspace:
          at: .
      - run: npm test
Notice the second move: persist_to_workspace. That's the bridge between jobs in the same workflow. The cache is for across runs; the workspace is for within a run. Confusing the two is one of the most common reasons people end up with bloated caches and slow workflows. We'll come back to that.
Parallelism: the knob that does more than you think
parallelism: N on a CircleCI job spins up N identical executors that all run the same job definition. Each one gets its own VM, its own cache, its own everything. The trick is that CircleCI gives each executor an index, CIRCLE_NODE_INDEX (0-based), and a total, CIRCLE_NODE_TOTAL, and it's your job to split the work between them.
This is the part that surprises people. Setting parallelism: 4 doesn't automatically make your tests run four times faster. It runs your entire job four times, in parallel, on four machines. If your npm test command runs the whole suite on each executor, you've just paid for four copies of the same green checkmark. Nice for redundancy, useless for speed.
The split has to be explicit. CircleCI provides circleci tests as a helper CLI baked into every executor, and the canonical pattern looks like this:
test:
  docker:
    - image: cimg/node:20.11
  parallelism: 4
  steps:
    - checkout
    - attach_workspace:
        at: .
    - run:
        name: Run unit tests for this shard
        command: |
          TESTS=$(circleci tests glob "test/**/*.test.js" | circleci tests split --split-by=timings)
          npx jest $TESTS
    - store_test_results:
        path: test-results
A few things are happening here, and each one matters:
circleci tests globlists files matching a pattern. It's a thin wrapper over shell globbing, but it normalises the output and integrates with the next step.circleci tests splitreads the glob list on stdin and outputs only the shard meant for the current executor (CIRCLE_NODE_INDEXofCIRCLE_NODE_TOTAL). With--split-by=timings, it uses test timing data from previous runs to balance the shards.store_test_resultsuploads the test output in JUnit XML so that future runs of this job have timing data to split on. Without this step,--split-by=timingshas no data and falls back to splitting by name, which is almost always worse.
That third point is the one that catches people. If you turn on --split-by=timings and never call store_test_results, you're splitting by name with extra ceremony. The first build after you enable both starts collecting data. From the second build onward, the splitter knows that test/integration/payments.test.js takes 47 seconds and test/unit/utils.test.js takes 0.2 seconds, and it tries to balance shards by total wall-clock time.
The three split-by strategies, ranked
circleci tests split accepts --split-by={timings,filesize,name}. They are not equivalent.
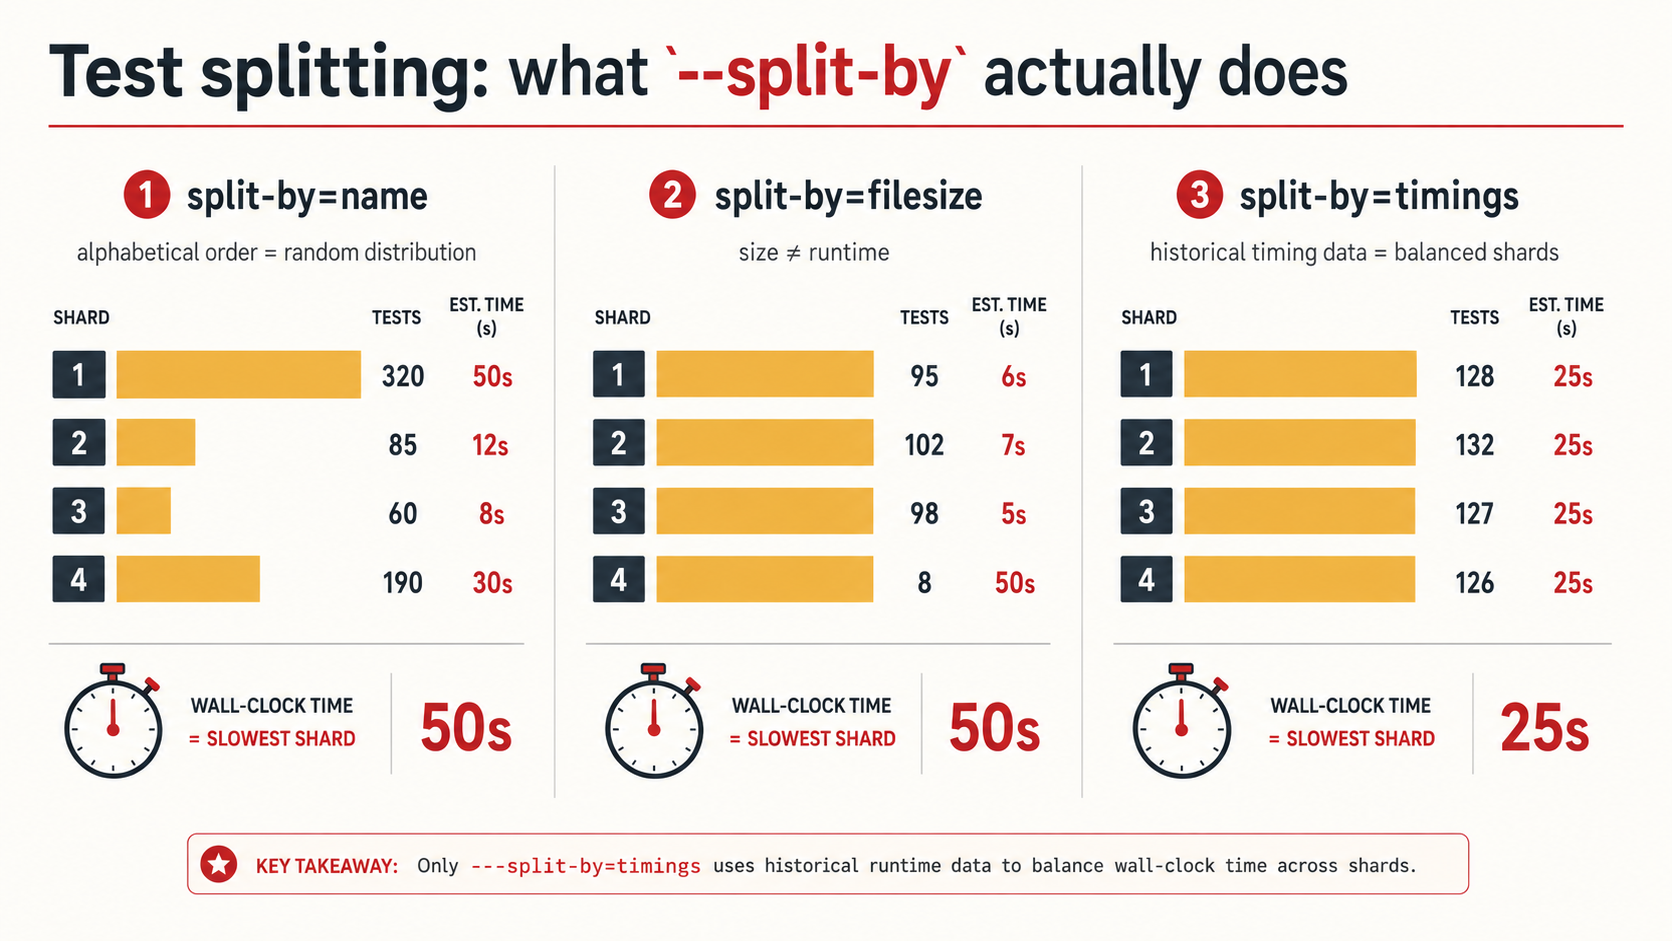
timings, the best general-purpose choice. Balances shards by historical test duration. Requiresstore_test_resultsin the same job. Falls back tonameon the first run.filesize, useful when you're splitting files that aren't tests (e.g., compiling many sources, processing many fixtures). Bigger file = more work, usually. Don't use it for tests; file size is a poor proxy for test runtime.name, alphabetical / hash-based split. The cheapest, dumbest option. Use it only when you have no timing data and don't care about balance.
Don't reach for filesize for tests because you've seen it in someone else's config. Use timings. The setup cost is two extra lines.
Watch out for the "shared global state" trap
The classic failure mode of parallelism isn't slowness, it's flake. Four executors hit the same database. Four executors all want to create the same fixture user with email test@example.com. Four executors fight over the same Redis namespace, the same S3 bucket prefix, the same row in a global counter table.
If your tests rely on any shared mutable state, a real database, a real cache, a real external service, you need to partition that state per shard before turning on parallelism. The cheap path is to namespace by CIRCLE_NODE_INDEX:
- run:
    name: Set up sharded DB schema
    command: |
      export DB_SCHEMA="test_shard_${CIRCLE_NODE_INDEX}"
      psql -c "CREATE SCHEMA IF NOT EXISTS ${DB_SCHEMA}"
      DB_SCHEMA=$DB_SCHEMA npm run migrate
For services you don't control, use a per-shard prefix in keys, paths, and identifiers. The rule of thumb: anything your tests write needs to live in a namespace that contains CIRCLE_NODE_INDEX.
Test splitting: the math behind the speedup
People talk about parallelism in marketing terms, "four executors, four-times speedup!", and it's almost never true. The actual math is more interesting and a lot more useful to understand.
If your test suite takes T seconds end-to-end and you split it into N shards, the minimum wall-clock time is T / N. You only hit that minimum if every shard takes exactly T / N seconds. In practice, there's always some imbalance, and your job takes as long as the slowest shard. So the real speedup is:
speedup = T / max(shard_times)If you have one shard that takes 5 minutes and three shards that take 1 minute each, your speedup over the unsplit 8-minute run is 8 / 5 = 1.6x, not 4x. You paid for four executors and got a 60% reduction in time. That's still good, but it's not what the marketing implied, and it's why --split-by=timings matters so much.
The second cost is the per-executor overhead. Every shard has to:
- Provision the executor (small, ~2-15 seconds)
- Checkout the code
- Restore cache / attach workspace
- Run setup (database migrations, env warmup, etc.)
- Run its slice of the actual tests
- Upload results
That fixed overhead is roughly constant per executor. Doubling parallelism doubles the overhead. There's an inflection point beyond which adding executors slows you down because the overhead grows faster than the test-time savings. For most suites, that inflection point is between 4 and 16 shards. If a 30-second test suite is split across 12 executors, every shard spends 20 seconds on setup and 2.5 seconds on tests. You'd have been better off with parallelism: 2.
A good rule: start at parallelism: 2, measure, increase until the slowest shard's test time (not total time) is roughly the same as the per-executor setup cost. Past that, you're just buying executors to watch them boot.
Workspaces vs caches: stop using one for the other
A workspace is per-workflow, ephemeral, and meant for handing artifacts between jobs in the same pipeline run. A cache is per-project, persistent, and meant for reusing work between runs. They look similar in YAML, but using one where you should use the other is a quiet source of slowness.
- Use a cache for things that are slow to produce and that change rarely:
node_modules,vendor/,~/.cache/pip, Docker base layers. The same cache is good across hundreds of runs. - Use a workspace for things that are produced in this workflow run and consumed by another job in the same run: the built binary, the compiled CSS bundle, the generated migration SQL, the OpenAPI spec extracted from your source. None of those should be cached, they're a function of the current commit and should be regenerated when the commit changes.
The mistake is caching the workspace-style artifacts ("we cache the dist folder!"). It seems clever, the dist folder doesn't need to be rebuilt if the source hasn't changed, but you've now reinvented incremental builds badly. Either let your build tool do the incremental work (most do) or use a cache keyed on the source files themselves, not on the lockfile. Trying to do both with one wrong key is a recipe for shipping a stale bundle.
Resource classes: the lazy 30%
CircleCI sells resource classes by CPU/memory size. The default is medium (2 vCPU, 4GB on Linux Docker). If your build is CPU-bound, Go compilation, TypeScript compilation, Rust, large test suites, bumping to large (4 vCPU, 8GB) often halves wall-clock time for less than 2x cost. You can set it per job:
build:
  docker:
    - image: cimg/go:1.22
  resource_class: large
  steps:
    - checkout
    - run: go build ./...
This isn't a substitute for parallelism, a single fast machine still serializes. But for jobs that are stuck on one critical-path step (the compile that everything else waits on), more vCPUs frequently buy you more than more executors would.
The catch is that resource classes are billed by credit-per-minute, and the credits scale roughly with the size. A 10-minute large job costs the same as a 20-minute medium job. If the speedup is at least 2x, it's free. If it's 1.5x, you're paying more for less wait. Measure before you upgrade across the board.
Docker layer caching, and why most teams don't need it
CircleCI offers Docker Layer Caching (DLC) as a paid premium feature on machine and remote_docker executors. It caches Docker image layers across builds so that docker build doesn't re-execute every step from scratch. When it helps, it helps a lot.
When does it help? When your Dockerfile does meaningful work during the image build, installs dependencies, compiles assets, runs codegen. The classic pattern of "copy in package.json, run npm install, then copy in source" benefits hugely because the dep-install layer survives across commits that only touch source files.
When does it not help? When you're using a pre-built cimg/* image and running your build steps inside the executor, not inside docker build. In that case, the work isn't happening as Docker layers and DLC has nothing to cache. Many CircleCI users are in this camp and don't realize it, they enable DLC, see no improvement, and shrug.
The decision tree:
- Is your job calling
docker buildto produce an application image? → DLC probably helps. - Is your job running
npm installandnpm testdirectly on the executor with nodocker buildinvolved? → DLC does nothing.
Conditional workflows: stop running work that doesn't need to run
The cheapest minute is the one you never spend. CircleCI's dynamic configuration feature lets a small "setup" workflow inspect the changed files in a commit and generate the actual config for the run. If only docs/ changed, you can skip the build, test, and deploy jobs entirely and emit a single one-step "docs-only" workflow.
The mechanics are: turn on setup: true at the top of the config, define a setup job, generate a YAML file (commonly with the path-filtering orb), and call continuation to launch it. The result is that a doc-only PR finishes in 30 seconds instead of 22 minutes. The same trick works for monorepos: detect which package changed, only run the workflow for that package.
This isn't free to set up, dynamic config has its own learning curve and adds a layer of indirection to your .circleci/config.yml, but for repos with high commit volume and uneven change distribution, it's the single biggest minute-saver per setup hour.
What to measure, in what order
Tuning blindly is how you end up with parallelism: 16 on a 4-test suite. Use CircleCI's Insights (free, included) to look at:
- Total job duration, broken down by step. The step taking the longest is your first target.
- Per-shard duration for parallel jobs. If you see one shard consistently 3x the others, your
--split-by=timingsdata is stale or your tests have shared state. - Cache hit rate. Job logs show "found a cache from key X" or "no cache found". If you're seeing "no cache found" on every run, your key is too tight (probably templating something that changes every commit, like
{{ .Revision }}). - Workflow duration vs critical-path job duration. If your workflow takes 12 minutes and the longest job takes 4, the other 8 minutes are sequential dependencies, look at your job graph for chances to parallelize stages, not just executors within a stage.
A worked example: from 22 minutes to 6
Pulling it all together. Here's the rough shape of what an "optimized" mid-sized Node.js pipeline looks like. Not a copy-paste solution, your numbers and shape will differ, but the pattern is portable.
version: 2.1

executors:
  node:
    docker:
      - image: cimg/node:20.11
    resource_class: medium

jobs:
  prepare:
    executor: node
    steps:
      - checkout
      - restore_cache:
          keys:
            - v4-deps-{{ arch }}-{{ checksum "package-lock.json" }}
            - v4-deps-{{ arch }}-
      - run: npm ci
      - save_cache:
          key: v4-deps-{{ arch }}-{{ checksum "package-lock.json" }}
          paths:
            - ~/.npm
            - node_modules
      - run: npm run build
      - persist_to_workspace:
          root: .
          paths:
            - node_modules
            - dist

  lint:
    executor: node
    steps:
      - checkout
      - attach_workspace:
          at: .
      - run: npm run lint

  typecheck:
    executor: node
    steps:
      - checkout
      - attach_workspace:
          at: .
      - run: npm run typecheck

  test-unit:
    executor: node
    parallelism: 4
    steps:
      - checkout
      - attach_workspace:
          at: .
      - run:
          name: Run unit test shard
          command: |
            TESTS=$(circleci tests glob "test/unit/**/*.test.js" | circleci tests split --split-by=timings)
            npx jest --reporters=default --reporters=jest-junit $TESTS
          environment:
            JEST_JUNIT_OUTPUT_DIR: ./test-results
      - store_test_results:
          path: test-results

  test-integration:
    executor: node
    resource_class: large
    parallelism: 2
    steps:
      - checkout
      - attach_workspace:
          at: .
      - run:
          name: Sharded DB setup
          command: |
            export DB_SCHEMA="test_shard_${CIRCLE_NODE_INDEX}"
            psql -c "CREATE SCHEMA IF NOT EXISTS ${DB_SCHEMA}"
            DB_SCHEMA=$DB_SCHEMA npm run db:migrate
      - run:
          name: Run integration test shard
          command: |
            TESTS=$(circleci tests glob "test/integration/**/*.test.js" | circleci tests split --split-by=timings)
            DB_SCHEMA="test_shard_${CIRCLE_NODE_INDEX}" npx jest --reporters=default --reporters=jest-junit $TESTS
          environment:
            JEST_JUNIT_OUTPUT_DIR: ./test-results
      - store_test_results:
          path: test-results

workflows:
  ci:
    jobs:
      - prepare
      - lint:
          requires:
            - prepare
      - typecheck:
          requires:
            - prepare
      - test-unit:
          requires:
            - prepare
      - test-integration:
          requires:
            - prepare
What's happening:
prepareruns once. It installs dependencies (cached), builds the app, and persistsnode_modules+distto the workspace.lint,typecheck,test-unit,test-integrationall start as soon aspreparefinishes, in parallel. Each attaches the workspace instead of re-installing.test-unitisparallelism: 4with timing-based splitting and JUnit reporting feeding next run's split.test-integrationuses a larger resource class (heavier work) andparallelism: 2, with each shard scoped to its own DB schema.- Caches are saved once in
prepareand never touched by downstream jobs, which only restore them through the workspace.
The four downstream jobs run concurrently, so the wall-clock cost is prepare + max(lint, typecheck, test-unit, test-integration). With well-balanced shards, that often lands around 5-7 minutes for a suite that ran 22 minutes in serial without caching.
What this doesn't fix
Honesty matters. None of this helps if:
- Your tests genuinely take 90 seconds each because of network calls to a real third-party API. Optimization has limits; sometimes the tests are slow for real reasons. Mock, stub, or accept the cost.
- Your build is dominated by
docker pushto a slow registry. Switch registries or use a closer region; CircleCI tuning won't help. - You have one giant test that takes 6 minutes alone. Splitting four ways still leaves that one shard at 6 minutes. The fix is in the test, not in the config.
Tuning CI is a game of returns. The biggest returns come from caching the right thing, sharding with the right strategy, and stopping work that doesn't need to happen. Once those are sorted, everything else is single-digit-percent gains, worth doing, but not where you start.
So: open your last slow build. Find the step that takes longest. Ask whether it's running with a cache, whether it could be sharded, and whether it should be running at all. If you answer those three honestly, you'll get most of the way to the four-minute pipeline before you ever touch a resource class.


