So, you've shipped a service on DynamoDB. Reads are fast, writes are fast, the table scales without you doing anything, and the team is happy.
Then the AWS bill arrives.
DynamoDB sits at the top of it. Three times what you projected. Nobody can quite explain why, and the dashboards are a sea of green: no throttles, no errors, no weird traffic spikes. Everything looks fine, and yet somehow this single table costs more than the EC2 fleet running the rest of your stack.
That's the thing about DynamoDB pricing. It's not unfair. It's not broken. It's just that the cost model is unusually mechanical. Every read, every write, every index, every byte you store is converted into a tiny, precise charge, and if you don't understand the conversion rate, you can't reason about the bill at all.
Let's break it down. What you're actually paying for, how RCUs and WCUs are calculated under the hood, when on-demand beats provisioned and when it doesn't, why item size is the lever you keep forgetting about, and how indexes turn into shadow tables on your invoice.
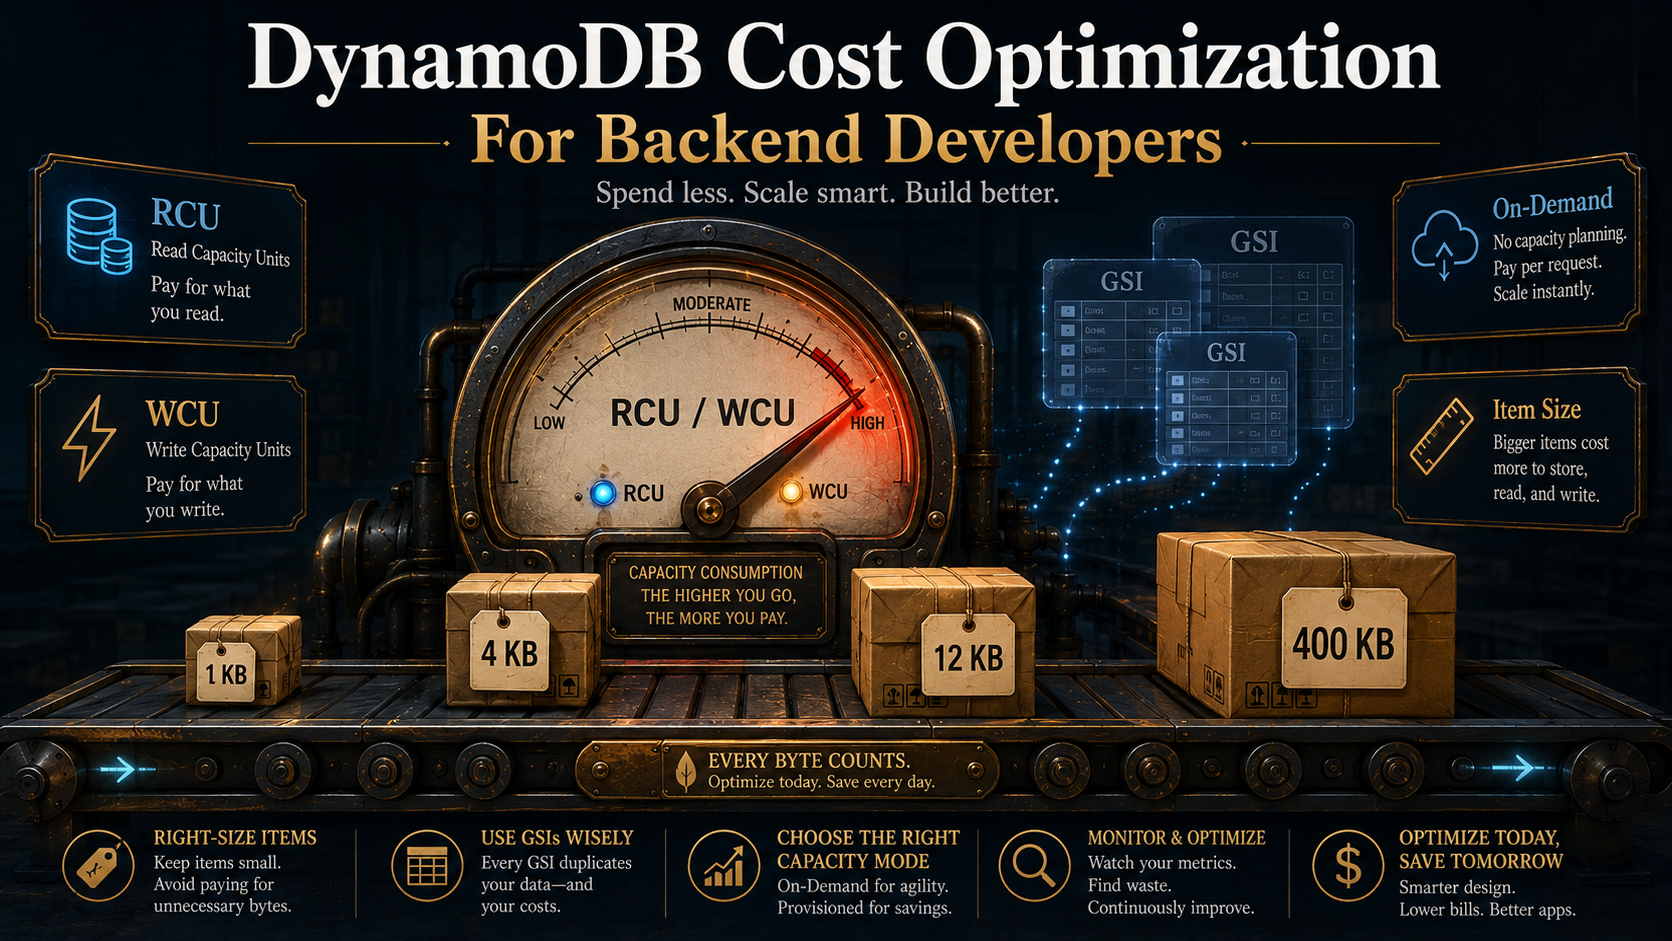
What You're Actually Paying For
DynamoDB charges you in four buckets, and the first step to controlling cost is knowing which bucket your workload lives in.
- Throughput: every read and every write costs something. This is almost always the biggest line item, and it's the one this article spends most of its time on.
- Storage: flat per-GB-month for the data sitting in your tables and indexes. Cheap, but it sneaks up on you when you keep historical data forever.
- Indexes: Global Secondary Indexes are billed essentially as separate tables. They have their own throughput, their own storage, and their own write amplification. We'll get to why that matters.
- Extras: DynamoDB Streams, point-in-time recovery (PITR), backups, global tables, DAX, Contributor Insights, Kinesis Data Streams export. Each one is opt-in but easy to forget about once enabled.
The rest of the article assumes you're paying attention to bucket #1 first. That's where 80% of cost-tuning wins live.
RCUs And WCUs: The Math That Owns Your Bill
Forget the marketing for a second. DynamoDB's pricing reduces to two units of measurement: the Read Capacity Unit (RCU) and the Write Capacity Unit (WCU). Both billing modes, on-demand and provisioned, are just different ways of paying for these units.
Here's the conversion table you actually need.
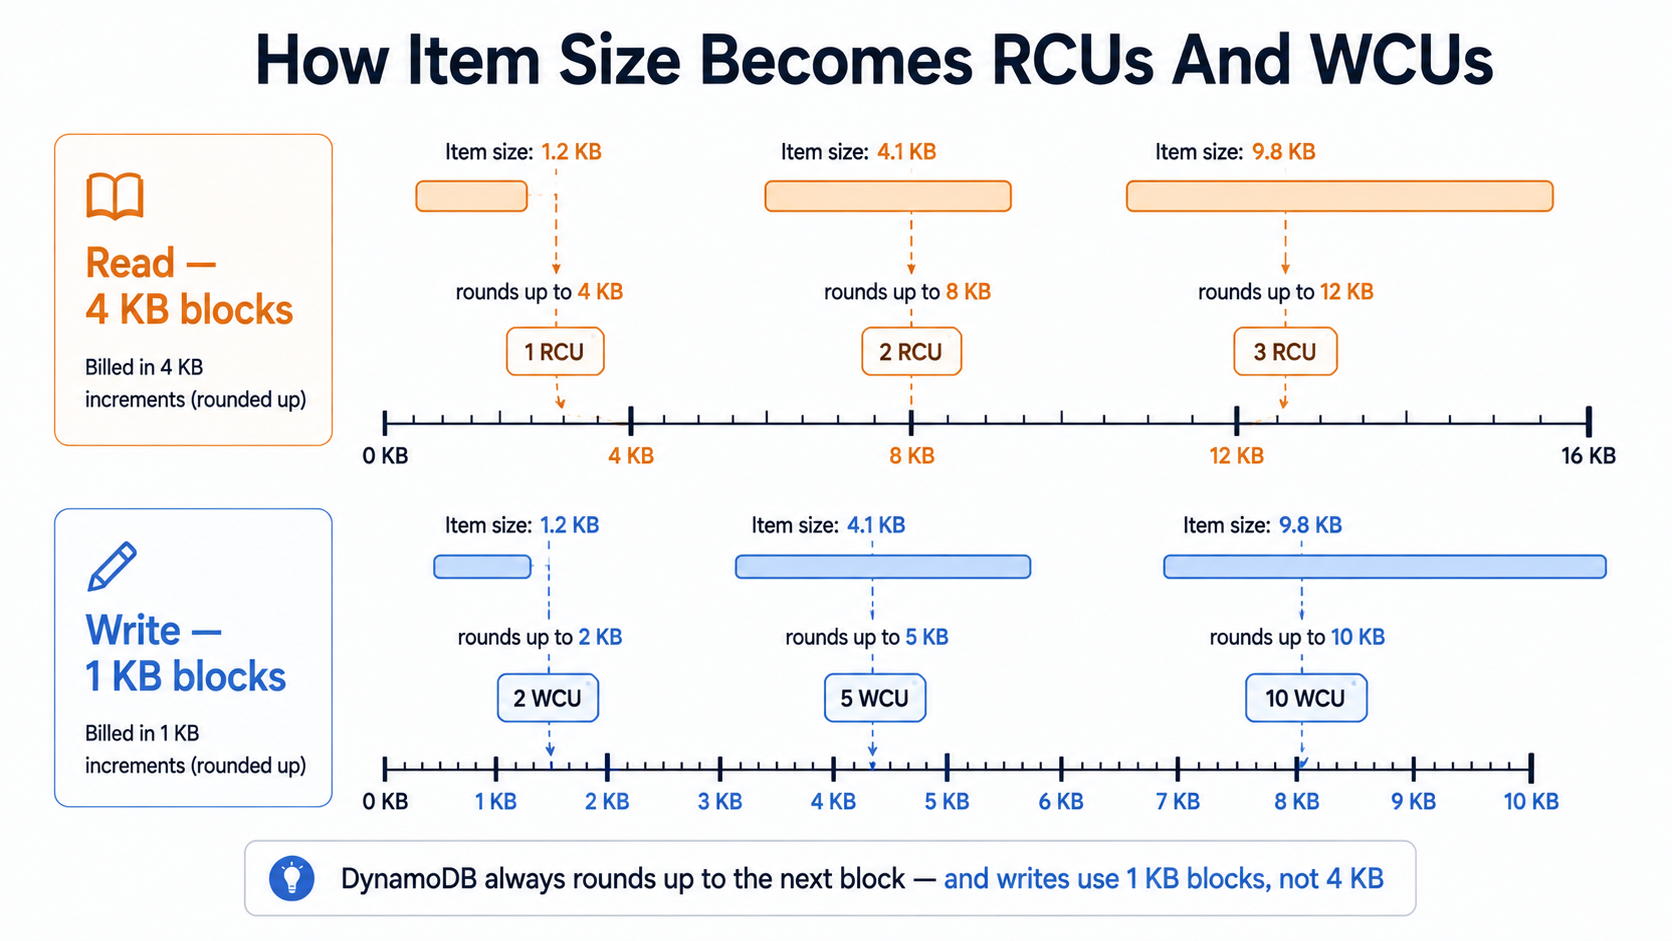
One RCU buys you, per second:
- One strongly consistent read of an item up to 4 KB.
- Two eventually consistent reads of an item up to 4 KB. (Eventually consistent reads are half-price by default, which is why they're the default.)
- Half of a transactional read. A transactional read costs 2 RCUs per 4 KB.
One WCU buys you, per second:
- One write of an item up to 1 KB.
- Half of a transactional write. A transactional write costs 2 WCUs per 1 KB.
There's no rounding kindness either. If your item is 4.1 KB, a strongly consistent read costs 2 RCUs, not 1.025. DynamoDB rounds up to the next 4 KB block for reads and the next 1 KB block for writes. Always up. Always per item, per request.
Two patterns fall out of this immediately.
Writes are 4x more expensive than strongly consistent reads of the same item, byte-for-byte. A 4 KB item is 1 RCU but 4 WCUs. If your workload is write-heavy, your bill will be dominated by WCUs, full stop. This is also why so many DynamoDB-on-fire stories involve someone realising mid-incident that they were doing strongly consistent reads when eventually consistent would've been fine. Flipping that flag halved the read bill overnight.
Transactions double the cost of whatever they wrap. A TransactWriteItems call writing two items doesn't cost 2 WCUs. It costs at least 4 WCUs, plus whatever the items round up to in size. Transactions are the right tool for some problems, but they're not free, and the cost scales with the number of items in the transaction. If you're using TransactWriteItems for things that could be conditional updates or idempotent retries, you're paying twice for nothing.
Read and write modes look like this in code (eventually consistent is the default, but it's worth being explicit):
import { DynamoDBClient, GetItemCommand } from "@aws-sdk/client-dynamodb";

const ddb = new DynamoDBClient({});

// Eventually consistent — half-price, slightly stale (default).
await ddb.send(new GetItemCommand({
  TableName: "Orders",
  Key: { orderId: { S: "abc123" } },
  // ConsistentRead omitted = false = eventually consistent
}));

// Strongly consistent — double the price, freshest read.
await ddb.send(new GetItemCommand({
  TableName: "Orders",
  Key: { orderId: { S: "abc123" } },
  ConsistentRead: true,
}));
import boto3
ddb = boto3.client("dynamodb")
# Eventually consistent (default).
ddb.get_item(
TableName="Orders",
Key={"orderId": {"S": "abc123"}},
)
# Strongly consistent.
ddb.get_item(
TableName="Orders",
Key={"orderId": {"S": "abc123"}},
ConsistentRead=True,
)import (
"context"
"github.com/aws/aws-sdk-go-v2/aws"
"github.com/aws/aws-sdk-go-v2/service/dynamodb"
"github.com/aws/aws-sdk-go-v2/service/dynamodb/types"
)
// Eventually consistent.
ddb.GetItem(ctx, &dynamodb.GetItemInput{
TableName: aws.String("Orders"),
Key: map[string]types.AttributeValue{
"orderId": &types.AttributeValueMemberS{Value: "abc123"},
},
})
// Strongly consistent.
ddb.GetItem(ctx, &dynamodb.GetItemInput{
TableName: aws.String("Orders"),
Key: map[string]types.AttributeValue{"orderId": &types.AttributeValueMemberS{Value: "abc123"}},
ConsistentRead: aws.Bool(true),
})A small flag, a big bill. Make the consistency level a deliberate decision, not a default.
On-Demand vs Provisioned: Pick The Right Default
DynamoDB has two billing modes. They charge for the same RCUs and WCUs, but the pricing curve is completely different.
Provisioned capacity asks you to declare, in advance, how many RCUs and WCUs you want. You pay for that capacity by the hour, whether you use it or not. If a traffic spike exceeds what you provisioned, you get throttled (returns to the SDK as ProvisionedThroughputExceededException). Auto-scaling can adjust the dial within bounds you set, but there's a built-in lag, usually minutes rather than seconds.
On-demand asks for nothing up front. You just send requests, and DynamoDB scales to handle them. Each request is billed per unit consumed. There's no throttling under normal conditions, only an "adaptive" warm-up if you go from zero to massive in one second.
The unspoken question every team asks is which one is cheaper. The honest answer is: it depends on your traffic shape, and the crossover point has been moving.
A few rules that hold up well:
- If your traffic is predictable and steady, provisioned with auto-scaling is usually cheaper, sometimes dramatically so. You can buy reserved capacity on top, locking in a discount in exchange for a one-year or three-year commitment. That gets you the lowest price per request DynamoDB sells.
- If your traffic is bursty, unpredictable, or has long quiet periods, on-demand is almost always the right call. You're not paying for idle capacity, and you can't get throttled at 3am because someone forgot to bump the auto-scaling ceiling. The peace of mind is worth real money.
- If your service is brand new and you have no idea what the traffic looks like, start on on-demand. Watch the bill for two weeks. If utilization is high and stable, switch to provisioned. If it's spiky, stay where you are. Switching from on-demand to provisioned is unrestricted and can be done at any time. Switching from provisioned to on-demand can be done up to four times per 24-hour period. Either way, this is a low-risk experiment.
A common trap: teams pick provisioned because it sounds cheaper, set the capacity at a nice round number based on a back-of-the-napkin guess, and then either pay for 90% idle capacity for a year or get paged at 2am because traffic doubled and auto-scaling didn't react fast enough. Provisioned mode is a tool, not a savings strategy. It only saves money when your forecast matches reality.
Item Size Is The Multiplier You Forgot About
Here's a version of a conversation that has happened more times than is funny.
"Why did our DynamoDB bill triple last quarter?"
"Traffic only grew 10%, that doesn't make sense."
"...we did add the new audit log fields to every order item."
Item size is a multiplier on every single read and write you do. If your average item grows from 1.5 KB to 5 KB, your write cost on those items goes from 2 WCUs to 5 WCUs. That's a 2.5x increase in write cost without a single new request. And if those items live in a GSI as well, the cost compounds again, because the GSI's items also grew.
A few patterns that quietly grow your items:
- Embedded blobs. A base64-encoded thumbnail. A serialised event payload "for debugging". A nested JSON of a third-party API response stored verbatim. These start small and become 50 KB before anyone notices.
- Audit metadata creep.
createdAt,updatedAt,createdBy,updatedBy,correlationId,traceId,version,lastModifiedReason. Each one is small, but they're on every item, on every write, in every index, forever. - String formats that are heavy. Storing a UUID as a
S(string) attribute uses 36 bytes. Storing it as aB(binary) attribute uses 16 bytes. For a billion-item table, that difference is real. - Default values written to every item. A field that's
null90% of the time still takes a few bytes for the attribute name itself, on every item. Don't write attributes that aren't meaningful. DynamoDB is schemaless on purpose.
Two practical fixes that move the needle.
Push large blobs to S3, store the URL. DynamoDB has a hard 400 KB item limit and you'll pay through the nose long before you hit it. If an attribute is ever over a few KB, ask whether it belongs in S3 with the DynamoDB row holding only the object key.
Use shorter attribute names. This sounds petty, and at small scale it is. At large scale, it isn't. The attribute name is part of the item size. A field called customerEmailAddress costs more bytes per write than a field called email, and that cost is paid on every write, every read, and on every replica in every GSI. Some teams compress every name to one or two characters at the storage layer ({"e": "..."}) and translate at the application boundary. This is overkill for most workloads, but if you're paying five figures a month and item size is the dominant cost, it can be a 30% reduction with no functional change.
A quick way to see what your real average item size is:
aws dynamodb describe-table --table-name Orders \
  --query 'Table.{Items: ItemCount, Bytes: TableSizeBytes}' \
--output json{
"Items": 12431902,
"Bytes": 41203847291
}Divide bytes by items and you've got your average. If that number has been creeping up, your write bill has been creeping up too, even if the request rate hasn't.
Indexes Are Just Other Tables
This is the section where most cost surprises actually live.
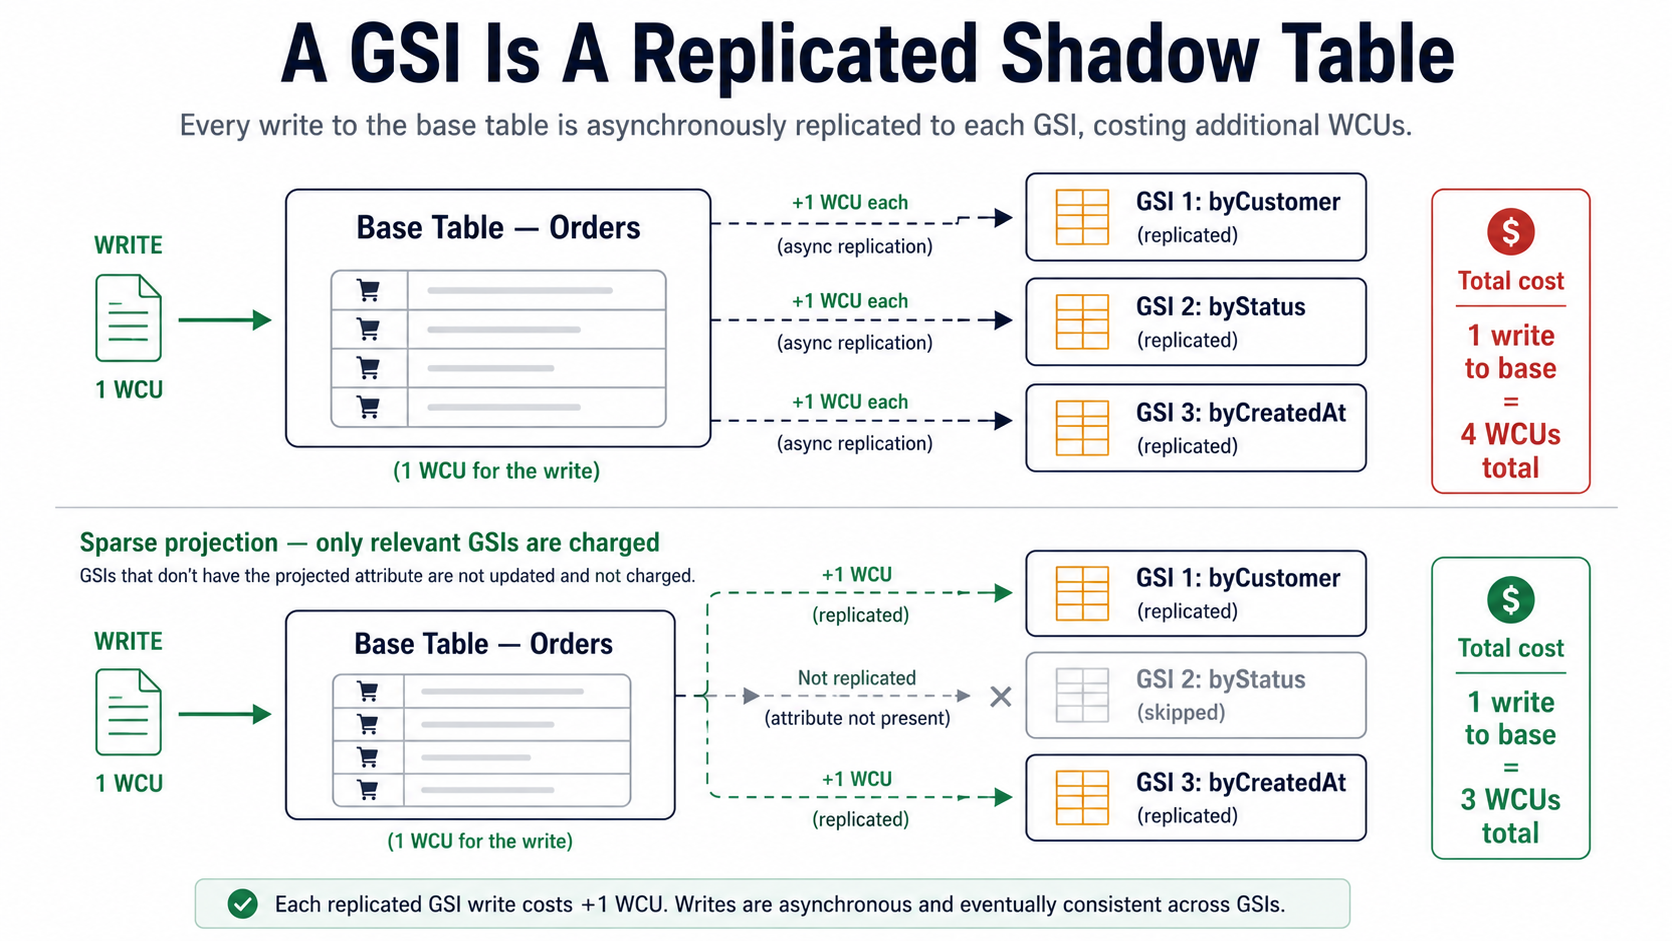
A Global Secondary Index (GSI) is not "an index on your table" in the way a B-tree index is "on" a relational table. It's a fully separate, asynchronously replicated copy of a subset of your data, with its own partition key, its own sort key, its own provisioned (or on-demand) throughput, and its own storage cost. When you write to the base table, DynamoDB also writes to every GSI whose projected attributes the write touched, and each of those propagated writes consumes its own WCUs.
If you have three GSIs on a table, every relevant write costs you up to 4 WCUs instead of 1: one for the base table, one for each affected GSI. Storage doubles or triples in the same way.
This is the part that ambushes teams. Someone adds a GSI to support a new query pattern. Three weeks later the bill quietly went up 60%. The query is fast, no alarms went off, and the GSI is doing exactly what it was supposed to. The cost was always there in the model. It's just that the per-request math is invisible until it adds up.
A few rules that genuinely help.
Project only what you query
When you create a GSI, you choose which attributes to copy into it. There are three options:
KEYS_ONLY: just the partition and sort keys of the base table and the index. Cheapest. Best when the GSI is purely a lookup, and you'll fetch the full item from the base table afterwards.INCLUDE: the keys plus a specific list of attributes. The middle ground. Use it when one or two extra fields cover the read pattern.ALL: every attribute on the item. Easiest to use, by far the most expensive. Each write replicates the entire item again, and storage roughly doubles.
The default in many infrastructure-as-code modules is ALL. Override it. If you only query the GSI for customerId lookups and you don't need the rest of the item, KEYS_ONLY is a 5x or 10x storage and write reduction over ALL.
Sparse indexes are free queries you didn't know you had
A GSI only stores items that actually have the indexed attribute. If you create a GSI on archivedAt, and only 0.1% of your items are ever archived, the GSI contains 0.1% of the data, not 100%.
This pattern is brilliant when you have a large table and a small subset you query frequently. Set the indexed attribute only on the items you care about, and the GSI becomes a tiny, cheap table optimized for that one query.
// Mark only orders that need follow-up. The GSI on `needsReview` becomes
// a sparse index — it contains only the small fraction of orders that
// ever had this attribute set.
await ddb.send(new UpdateItemCommand({
  TableName: "Orders",
  Key: { orderId: { S: "abc123" } },
  UpdateExpression: "SET needsReview = :v",
  ExpressionAttributeValues: { ":v": { S: "true" } },
}));

// Later: clear it when the review is done. The item drops out of the GSI
// entirely (DynamoDB removes the GSI entry when the indexed attribute
// is removed).
await ddb.send(new UpdateItemCommand({
  TableName: "Orders",
  Key: { orderId: { S: "abc123" } },
  UpdateExpression: "REMOVE needsReview",
}));
The "items needing review" query becomes a Query against a small sparse GSI instead of a scan of the whole table. That's the difference between a free operation and an expensive one.
Audit your existing indexes
Most teams have GSIs they no longer need: ones added for a feature that got rolled back, or for a query the application stopped running six months ago. Each one is a tax on every write to that table.
CloudWatch publishes per-index ConsumedReadCapacityUnits and ConsumedWriteCapacityUnits metrics. Look at the read metric over the last 30 days for every GSI on every meaningful table. If a GSI's read consumption is essentially zero, the application isn't using it. Drop it. The write savings show up on the next bill.
Where The Money Actually Goes
A handful of patterns account for the majority of "why is this bill so high" investigations. Knowing them by name lets you spot them in your own service before the bill does.
The hot partition. Each physical partition in DynamoDB has hard limits: roughly 1000 WCUs and 3000 RCUs of raw throughput, plus an "adaptive capacity" boost that lets one partition borrow from quieter ones nearby. If your partition key concentrates traffic on one value (e.g., a status field with "active" covering 95% of items, or a tenant ID where one tenant is 100x bigger than the others), you'll throttle long before you hit your overall provisioned limit, and you'll spend money chasing the symptom instead of the cause. Partition keys want high cardinality and even distribution. If yours don't, no amount of capacity can save the bill.
The giant item. Every read of a 380 KB item is 95 RCUs (380 / 4, rounded up). Most of the time, half a kilobyte of that item is what the reader actually wants. Splitting hot items into a smaller "summary" record and a separate "details" record can drop read cost by an order of magnitude.
The over-projected GSI. Already covered, but worth repeating: ProjectionType: ALL on every GSI is the single most common cost mistake on production tables. Default it to KEYS_ONLY and add fields when the query pattern justifies it.
The query that should have been a BatchGetItem. Issuing 100 individual GetItem calls in a loop costs roughly the same in capacity as one BatchGetItem for 100 keys, but the batch version is one network round-trip and a fraction of the SDK overhead. The capacity bill is the same, but the latency bill (and the indirect cost of busy compute) drops a lot.
The retry storm with backoff turned off. When DynamoDB throttles a request, the AWS SDK retries it, and each retry consumes capacity again if it succeeds. A misconfigured or aggressive retry policy during a partial outage can multiply your usage by 5x in a few minutes. The default SDK retry configuration is sensible; deviating from it without strong reason has burned plenty of teams.
The forgotten Stream consumer. DynamoDB Streams are billed per stream-read-request unit. If you enabled a stream months ago for a Lambda that no longer exists, the stream is still being written. It's small money, but it's the kind of small money that only gets caught when someone audits the table list manually.
TTL Is The Cheapest Cost Optimization You'll Ever Apply
This one is almost embarrassingly simple. DynamoDB has a built-in TTL feature: you mark one attribute on the table as the TTL attribute, and any item whose TTL value is in the past will eventually be deleted by DynamoDB itself, for free. The deletes don't consume WCUs. They don't show up on your bill. They just happen.
// Set TTL when writing the item. Value is a Unix timestamp in seconds —
// not milliseconds. The attribute name is whatever you configured on the
// table (commonly `ttl` or `expiresAt`).
const expiresAt = Math.floor(Date.now() / 1000) + 60 * 60 * 24 * 90; // 90 days

await ddb.send(new PutItemCommand({
  TableName: "Sessions",
  Item: {
    sessionId: { S: "sess_abc" },
    userId: { S: "u_123" },
    expiresAt: { N: String(expiresAt) },
  },
}));
If your table has any concept of "this data is irrelevant after N days": sessions, idempotency keys, audit events older than the retention window, cached responses, ephemeral signals. Turn TTL on. The savings are continuous and invisible. The cost of leaving stale data forever is also continuous and invisible, which is why it's so easy to ignore.
A small caveat: TTL deletion isn't instant. AWS publishes a guarantee of "within 48 hours of expiration" for typical workloads, but in practice it's usually within a few minutes for hot items. If your application logic depends on the item being gone the moment its TTL passes, filter on the TTL value at read time as well as relying on the cleanup.
A Workflow For Taming The Bill
When the DynamoDB number on the invoice is too high, the loop looks something like this.
- Open Cost Explorer. Filter to DynamoDB. Group by
UsageTypeandResource(table). Find the top three line items. - For each table, look at CloudWatch's
ConsumedReadCapacityUnitsandConsumedWriteCapacityUnitsper index. If a GSI is dominating, that's your first target. - Check the average item size (
TableSizeBytes / ItemCount). If it's growing, your writes are getting more expensive even at constant request rate. - Check the projection on every GSI. If any are
ALLand don't need to be, change them. Even one rebuild can drop write WCU consumption by half. - Check the consistency level on hot reads. If anything that doesn't strictly need fresh data is using strongly consistent reads, drop it.
- Check whether you're on the right billing mode. If utilization on a provisioned table is below ~30% steady-state, you're overpaying for headroom you're not using. If it's above ~70% steady-state and stable, on-demand is probably costing you more than provisioned with auto-scaling would.
- Audit indexes. Drop the dead ones.
- Audit transactions. If you're using
TransactWriteItemsfor writes that don't need atomicity across multiple items, you're paying double for nothing.
Six of those eight steps cost nothing to investigate and produce no application risk. Most teams find at least one easy win before they get to step five.
DynamoDB rewards you for understanding its cost model. The same table can run for $50/month or $5000/month depending on whether you've thought about how the items are shaped, how the indexes are projected, and which billing mode matches your traffic. None of it is hidden: it's all in describe-table, in CloudWatch, and in the same billing console you've been looking at.
Look at the meter. Read the numbers. Most of the savings are right there.