You ship a feature, traffic looks fine in staging, and the dashboard is green for the first three days in production.
Then a marketing email goes out, a Twitter post takes off, or the cron job that backfills last quarter's analytics fires at midnight.
And your DynamoDB table starts throttling.
The provisioned capacity says you're at 30% utilization. The CloudWatch graphs look almost lazy. But the writes keep returning ProvisionedThroughputExceededException, and your queue is backing up.
You're not out of capacity. You're out of capacity on one partition.
That's a hot partition. And once you've met one, you start seeing them everywhere.
What a hot partition actually is
DynamoDB doesn't store your table as one big blob. It splits it into physical partitions, and each item lives on exactly one of them. Which partition? DynamoDB hashes your item's partition key and uses the hash to pick a partition.
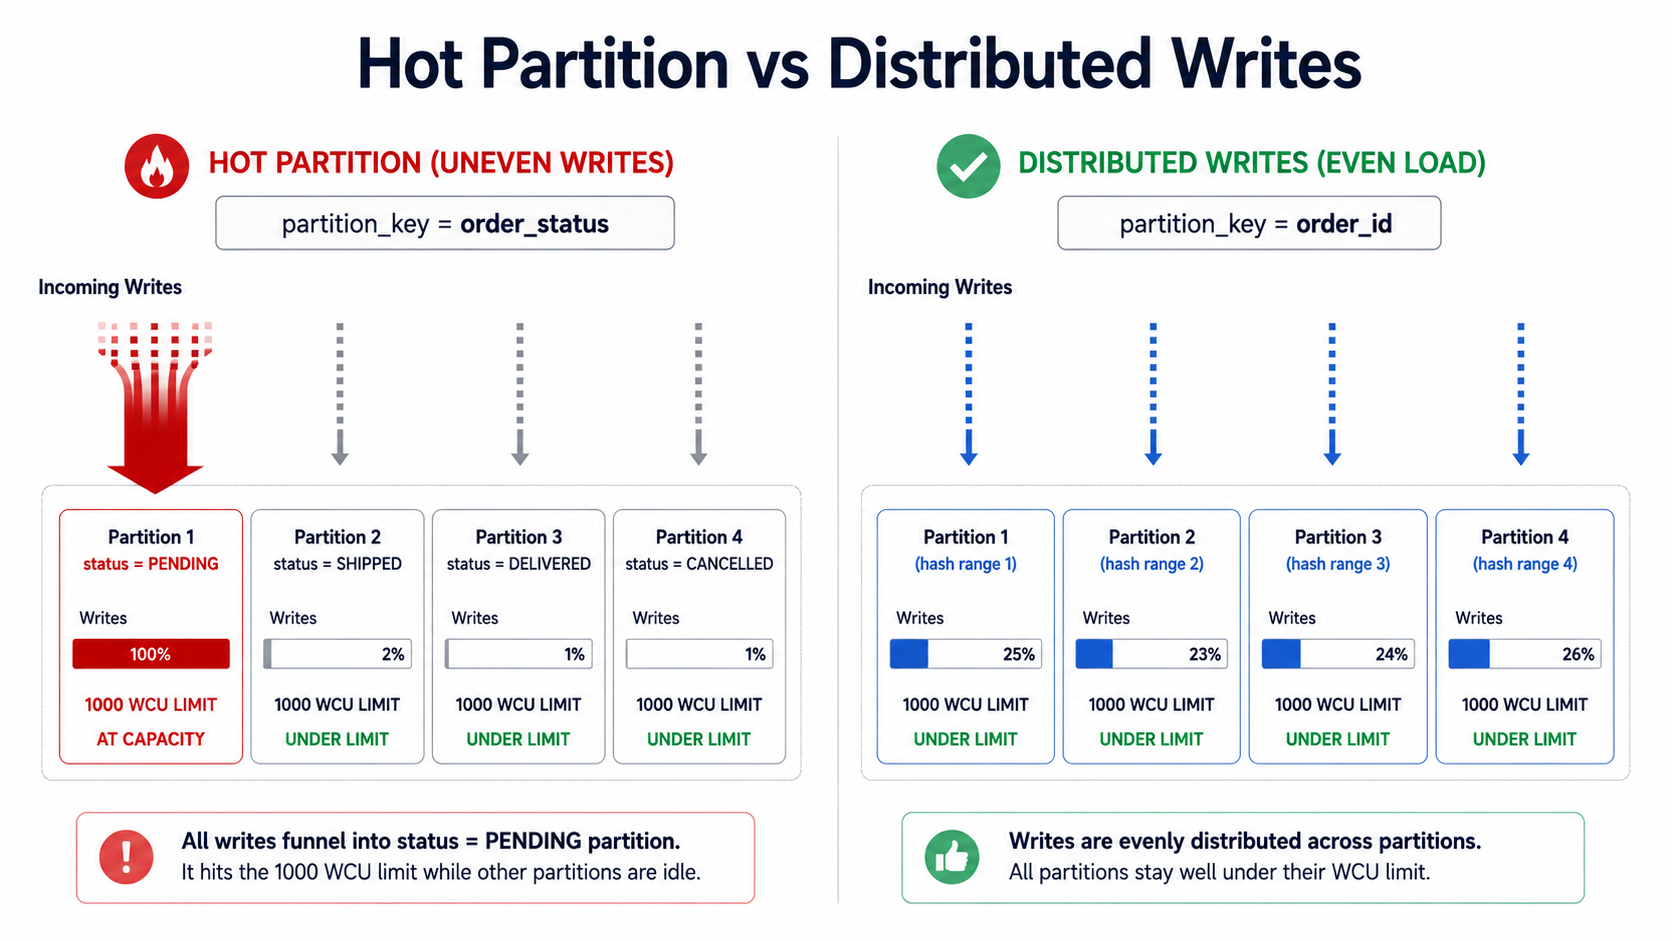
That hashing is the whole point. If your partition keys are well-distributed, the hash spreads writes across all your partitions, and capacity gets used evenly. If your partition keys clump, where a huge share of writes hit the same key or a small set of keys, those writes all land on the same physical partition, and that partition's throughput limit becomes your real ceiling.
Each physical partition has hard caps:
- 1,000 WCU/sec (write capacity units, roughly 1,000 writes/sec for items ≤ 1 KB).
- 3,000 RCU/sec (read capacity units, roughly 3,000 strongly consistent reads/sec, or 6,000 eventually consistent).
- 10 GB of stored data.
It doesn't matter if you provisioned 100,000 WCU on the table. A single partition will still cap at 1,000. The other 99,000 WCU is spread across the rest of your partitions, doing nothing for the one that's on fire.
That's why your dashboard looks fine while your inserts time out. Average utilization is meaningless when one partition is at 100% and nine others are at 5%.
How a hot partition actually shows up
In production, hot partitions rarely arrive as a clear signal. They show up as one of these:
You see ProvisionedThroughputExceededException in your logs even though the table-level CloudWatch graph says you're below provisioned capacity. That's the classic case.
Your SDK starts retrying aggressively. Latency for that table spikes from 5 ms to 200 ms because every other request is getting throttled and exponentially backed off.
Your dead-letter queue starts filling up with items that share a suspicious pattern in their partition key: same tenant, same status, same date.
A specific endpoint slows to a crawl after a campaign or job kicks off, but only that endpoint. Everything else is fine.
If you're on on-demand billing instead of provisioned, the symptom shifts but doesn't disappear. On-demand still has per-partition limits, and DynamoDB ramps capacity by doubling, so a sudden 10x spike on a hot key can throttle for several minutes while the table catches up.
How teams accidentally build hot partitions
You don't need bad code to build a hot partition. You just need a partition key whose values aren't evenly distributed across the requests you're actually serving. A few patterns show up over and over:
Using a status field as the partition key. Something like pk = order_status, sk = order_id. Sounds reasonable until you realize 70% of your orders are in status PENDING at any given moment, and every new order hits the same partition.
Using a timestamp or date as the partition key. pk = "2026-05-10" looks tidy in the console. But during the day all writes hit one partition; the previous day's partition goes idle; tomorrow you migrate the heat to a new partition. You've built a moving hot spot.
Using a tenant ID where one tenant is 90% of traffic. Multi-tenant SaaS apps love pk = tenant_id. Then your biggest customer signs up, becomes 90% of your traffic, and now their partition is permanently glowing while the rest of the cluster naps.
Using a "global" sentinel key for counters or feeds. pk = "GLOBAL_FEED" so you can fetch the latest activity. Every write to the feed hits one item, one partition. The read pattern made sense; the write distribution didn't.
Using a sequentially increasing ID. Some teams use auto-incrementing or monotonic IDs as the partition key, thinking the hash will spread them. The hash does spread them, but during a bulk write every concurrent insert is using "the latest" range of IDs, and behaviorally you get clusters anyway.
The common thread isn't laziness. It's that the partition key was chosen for what made the query convenient, without auditing what the write distribution looked like at peak.
Detecting hot partitions before they wake you up
You can find these before production does. DynamoDB gives you three tools for this:
CloudWatch metrics, specifically ConsumedWriteCapacityUnits and ConsumedReadCapacityUnits per table, plus the ThrottledRequests and WriteThrottleEvents metrics. If your table is throttling while total consumption is below provisioned capacity, that's the giveaway. The math doesn't lie: you're not out of capacity on the table, you're out on a partition.
CloudWatch Contributor Insights for DynamoDB. This one is purpose-built. Once you enable it on a table or index, AWS tracks the most-accessed partition keys and shows you the top contributors over time. If one tenant_id shows up at the top of your write graph 24/7, you've found your hot partition.
Your own application-side instrumentation. Log the partition key for every write, sample it, and feed the samples to a dashboard. The naive histogram of partition key counts will tell you everything within an hour of looking at it.
The fixes: designing partition keys for write distribution
There's no single "right" partition key. There's only "the right key for this access pattern at this scale." But the techniques to spread writes across partitions are well-known. Pick the one that matches the shape of your data.
Write sharding (the classic fix)
Suffix or prefix your partition key with a random integer in a fixed range. Instead of pk = "GLOBAL_FEED", you write to pk = "GLOBAL_FEED#0", pk = "GLOBAL_FEED#1", ..., pk = "GLOBAL_FEED#N-1". Picks one shard at random on each write.
You pay for it on reads: you now have to query all N shards and merge results in your app. But for write-heavy access patterns where reads are rare or can be precomputed, this is the cleanest fix.
import { DynamoDBClient, PutItemCommand } from "@aws-sdk/client-dynamodb";

const SHARD_COUNT = 10;
const client = new DynamoDBClient({});

async function writeFeedEvent(event: { id: string; payload: string }) {
  const shard = Math.floor(Math.random() * SHARD_COUNT);
  await client.send(
    new PutItemCommand({
      TableName: "GlobalFeed",
      Item: {
        pk: { S: `GLOBAL_FEED#${shard}` },
        sk: { S: event.id },
        payload: { S: event.payload },
      },
    })
  );
}
import random
import boto3
SHARD_COUNT = 10
ddb = boto3.client("dynamodb")
def write_feed_event(event_id: str, payload: str) -> None:
shard = random.randint(0, SHARD_COUNT - 1)
ddb.put_item(
TableName="GlobalFeed",
Item={
"pk": {"S": f"GLOBAL_FEED#{shard}"},
"sk": {"S": event_id},
"payload": {"S": payload},
},
)package feed
import (
"context"
"fmt"
"math/rand"
"github.com/aws/aws-sdk-go-v2/aws"
"github.com/aws/aws-sdk-go-v2/service/dynamodb"
"github.com/aws/aws-sdk-go-v2/service/dynamodb/types"
)
const shardCount = 10
func WriteFeedEvent(ctx context.Context, client *dynamodb.Client, id, payload string) error {
shard := rand.Intn(shardCount)
_, err := client.PutItem(ctx, &dynamodb.PutItemInput{
TableName: aws.String("GlobalFeed"),
Item: map[string]types.AttributeValue{
"pk": &types.AttributeValueMemberS{Value: fmt.Sprintf("GLOBAL_FEED#%d", shard)},
"sk": &types.AttributeValueMemberS{Value: id},
"payload": &types.AttributeValueMemberS{Value: payload},
},
})
return err
}Reading later means a scatter-gather across the N shards:
import { DynamoDBClient, QueryCommand } from "@aws-sdk/client-dynamodb";

const SHARD_COUNT = 10;
const client = new DynamoDBClient({});

async function readRecentFeed(limit: number) {
  const queries = Array.from({ length: SHARD_COUNT }, (_, shard) =>
    client.send(
      new QueryCommand({
        TableName: "GlobalFeed",
        KeyConditionExpression: "pk = :pk",
        ExpressionAttributeValues: { ":pk": { S: `GLOBAL_FEED#${shard}` } },
        Limit: limit,
        ScanIndexForward: false,
      })
    )
  );

  const results = await Promise.all(queries);
  const items = results.flatMap((r) => r.Items ?? []);
  // merge-sort by sort key, take top `limit`
  return items.sort((a, b) => (a.sk.S! < b.sk.S! ? 1 : -1)).slice(0, limit);
}
Pick SHARD_COUNT based on how much write throughput you actually need. If one partition gives you 1,000 WCU and you need 8,000, ten shards is plenty. Don't shard into 100 partitions if you only need 8.
Deterministic sharding when reads need to be cheap
Random sharding is great for writes, painful for reads. If you need to read a specific item often, you can shard deterministically: derive the shard from something on the item itself, so a reader knows exactly which shard to look in.
A common pattern: shard by a hash of the user ID or the entity ID, not by a random number.
import hashlib

SHARD_COUNT = 16

def shard_for_user(user_id: str) -> int:
    h = hashlib.md5(user_id.encode()).hexdigest()
    return int(h, 16) % SHARD_COUNT

def partition_key_for_user_event(user_id: str) -> str:
    return f"USER_EVENT#{shard_for_user(user_id)}"
Now any code that knows the user_id can compute the partition key directly: no scatter-gather. You've still spread writes across 16 partitions, but reads for a specific user are one query.
The trade-off: you've fixed the shard count for that table forever. If you ever want to reshard, you're migrating data. Pick a number larger than you think you need (16, 32, 64) and don't sweat it. Empty shards cost essentially nothing.
Better partition key choice (sometimes the cheapest fix is the right one)
Before reaching for sharding, ask whether you picked the wrong partition key in the first place. Sharding adds complexity. A better key avoids the problem entirely.
If you originally chose pk = order_status, the fix isn't sharding. Switch to pk = order_id instead. Status is low-cardinality and skewed; order ID is high-cardinality and uniformly distributed. The catch is that your access pattern probably wanted "give me all PENDING orders," which pk = order_id doesn't support directly. That's what GSIs (global secondary indexes) are for: create a sparse GSI keyed on status only for items that are PENDING, and the index becomes small and fast. The base table stays cool.
Similarly, if your partition key is a timestamp like pk = "2026-05-10", ask whether you actually need to query by day. If yes, keep the date in the sort key and put something high-cardinality in the partition key. pk = user_id, sk = "2026-05-10#event_id" distributes writes across users and still supports "find this user's events on this day."
Time bucketing (when time really is the access pattern)
Sometimes you do want to query by time window, and you can't move the time off the partition key. Common case: an event log queried by day or hour.
The trick is to widen your time bucket so writes spread across several buckets at once. Instead of pk = "2026-05-10", use pk = "2026-05-10#H14#S03", combining date, hour, and a random 0-N shard. Within a single hour, your writes spread across N partitions. Reads for "events on 2026-05-10" do scatter-gather across (24 hours × N shards) partitions, slow if N is huge, fine if N is single digits.
function bucketKeyForNow(shardCount = 8) {
  const now = new Date();
  const date = now.toISOString().slice(0, 10); // 2026-05-10
  const hour = now.getUTCHours().toString().padStart(2, "0");
  const shard = Math.floor(Math.random() * shardCount);
  return `${date}#H${hour}#S${shard}`;
}
Caching the hottest items at the application layer
Sometimes "I'm getting throttled on one item" doesn't need a key redesign. It needs a cache.
If 95% of your reads are for the same handful of items, think a popular product page, your company's homepage feed, or a config record, DynamoDB Accelerator (DAX) or a plain ElastiCache layer in front absorbs the read heat. The base table still serves a small steady stream and never feels the spike.
This doesn't help with hot writes; caches sit in front of reads. But "we're throttling on reads to one item" and "we're throttling on writes to one partition" look identical in the logs at first glance. Always check which side is hot before you redesign the schema.
Adaptive capacity and on-demand mode: what they fix and what they don't
DynamoDB has had adaptive capacity since around 2017, and "instant adaptive capacity" since 2019. The idea: when one partition gets hot, DynamoDB temporarily lends it unused capacity from cooler partitions on the same table. In 2019 AWS also added isolation of frequently-accessed keys so a single hot key can sometimes get its own partition automatically.
This helps. It does not save you.
Adaptive capacity papers over moderate skew. If one partition is at 1.5x its fair share, adaptive capacity probably handles it invisibly and you'll never see a throttle. If one partition is at 50x its fair share, like your GLOBAL_FEED case or a 90%-share tenant, adaptive capacity can't stretch that far. You'll still throttle, just less than you would have without it.
On-demand billing mode has the same shape. It scales table capacity automatically, but each partition still has the same 1,000 WCU / 3,000 RCU ceiling. On-demand removes the work of right-sizing the table, but it doesn't change the physics of how DynamoDB distributes load.
What this looks like in practice
If you remember nothing else, remember this loop:
Audit your existing tables for skewed access patterns. Enable Contributor Insights for a day on each large table and look at the top partition keys. If one key dominates by an order of magnitude, that's your suspect.
For new tables, sketch the write distribution before you sketch the read patterns. Ask "if we ran this at 10x today's load, would the writes still spread?" If you can't answer yes, the partition key is wrong, and you'll be redesigning it on call.
When you genuinely have a hot key, whether a high-volume tenant, a global counter, or a sequential feed, pick the right sharding flavor. Random sharding for write-heavy + cold reads. Deterministic sharding for read-heavy. Time bucketing for time-windowed queries. Better key choice when the access pattern allows it.
Don't shard preemptively. Sharding is complexity. Most tables don't need it, and the ones that do will tell you loudly through CloudWatch.
DynamoDB rewards thinking about your write pattern with the same care you'd give your read pattern. Once you do that, hot partitions stop being a surprise. They become a thing you spotted on a graph weeks before they would have woken you up.