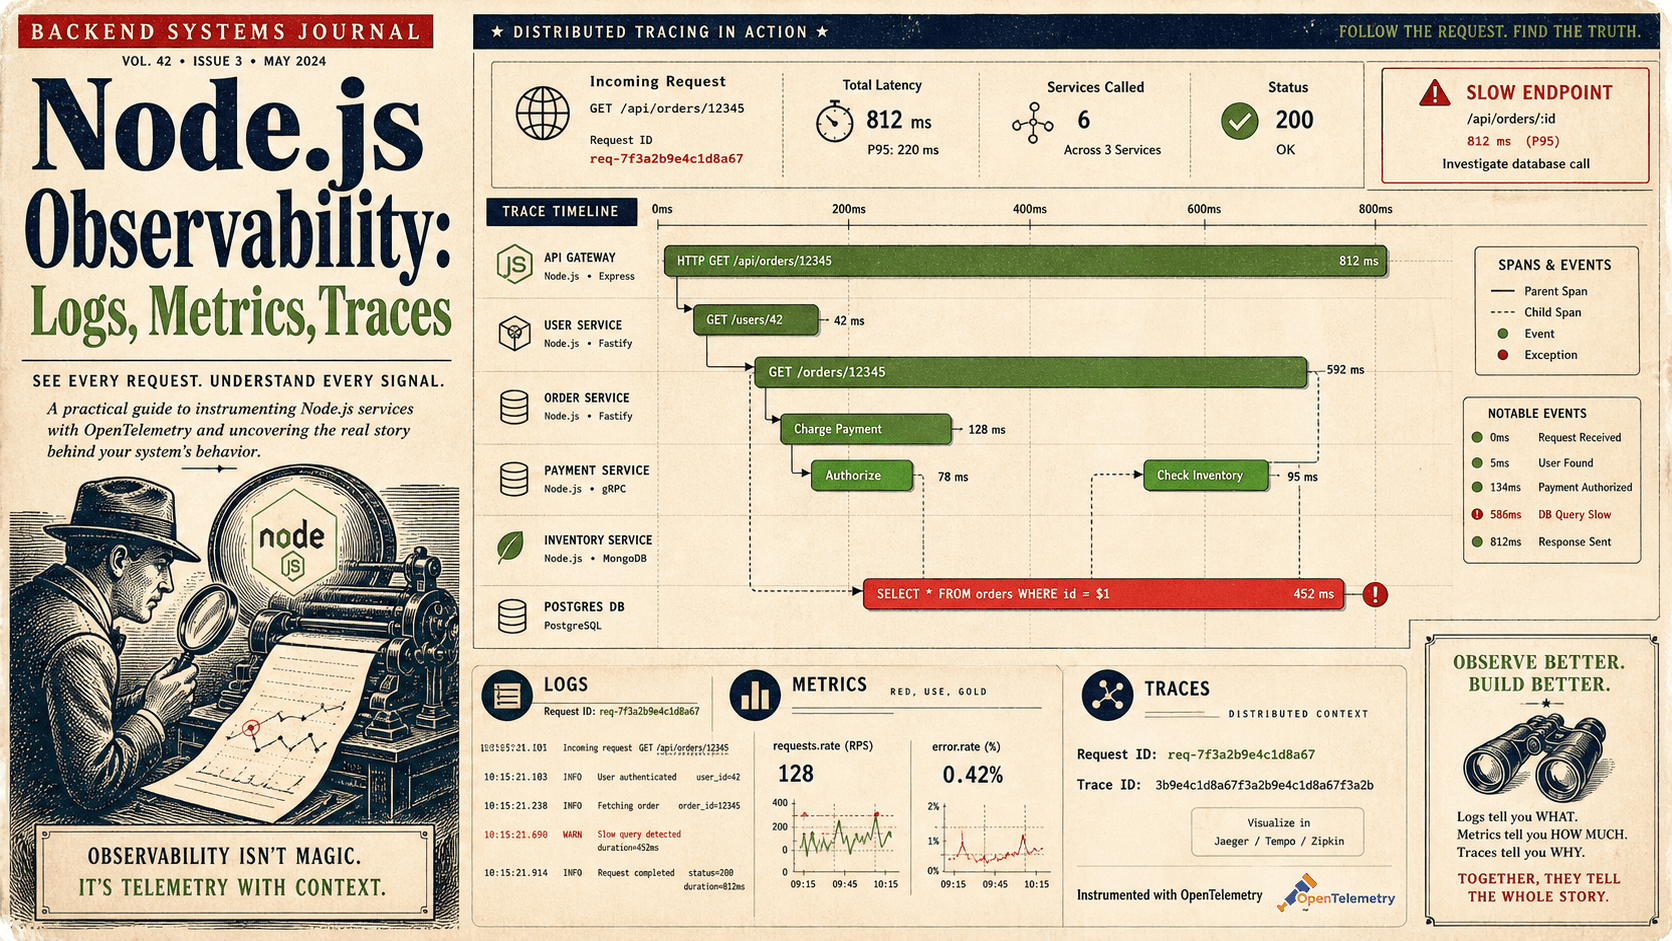
A Node.js service that's struggling rarely tells you out loud. Latency creeps up by a few hundred milliseconds. The p99 chart tilts. Error rates stay flat. CPU on the host looks fine, maybe 40%, sometimes less. Memory looks fine. The database looks fine. And yet the service feels slow, and you can't put your finger on why.
There's one number that almost always answers the question, and most teams aren't watching it: event loop lag. It's the delay between when a timer or callback was supposed to run and when it actually did. In a healthy Node process, that delay is in single-digit milliseconds. When it climbs into the tens or hundreds, you're not slow because of the database, the network, or the upstream API. You're slow because Node's main thread is stuck doing something synchronous, and every request behind that work is waiting in line.
This piece is about how to monitor event loop lag in a production service, not just measure it once on a laptop. The instrumentation is short. The interesting part is what to do with the numbers once you have them.
What Lag Actually Measures
Node runs JavaScript on one thread. The event loop cycles through phases (timers, pending callbacks, idle, poll, check, close) and at each phase it picks up callbacks that are ready and runs them. If a callback takes 50 milliseconds of pure CPU work, every other callback waits at least 50 milliseconds.
Event loop lag is how late the loop is, relative to when it wanted to wake up. You ask the loop "please run this in 10ms," and you check how long it actually took. If it came back in 10.2ms, lag is 0.2ms. If it came back in 320ms, you have a problem.
The metric is honest in a way most application metrics aren't. Latency depends on the upstream. Error rate depends on what's failing. CPU% is a coarse aggregate. But lag is a direct measurement of "is my Node process responsive right now." If lag is low, requests are flowing through. If lag is high, nothing else matters until you fix it.
The Built-In Way: monitorEventLoopDelay
Node ships a high-resolution histogram-based monitor in node:perf_hooks. It's the right default for a production service: it samples continuously at a resolution you pick, gives you percentiles instead of averages, and costs almost nothing.
import { monitorEventLoopDelay } from 'node:perf_hooks';

const histogram = monitorEventLoopDelay({ resolution: 20 });
histogram.enable();

export function snapshotLag() {
  return {
    p50_ms: histogram.percentile(50) / 1e6,
    p90_ms: histogram.percentile(90) / 1e6,
    p99_ms: histogram.percentile(99) / 1e6,
    max_ms: histogram.max / 1e6,
  };
}

export function resetLag() {
  histogram.reset();
}
A few things worth knowing about this API:
resolution: 20means the loop samples itself every 20ms. The reported lag is "how late did the 20ms timer actually fire." Lower resolution gives finer detail at slightly higher cost. 10-20ms is the sweet spot for a typical web service.- Values come back in nanoseconds, which is why every example divides by
1e6to get milliseconds. The number of teams that have been confused by a 50,000,000ms lag report is non-zero. - The histogram accumulates between resets. If you want a rolling window, say the last minute, call
reset()on a schedule, after you've scraped the values.
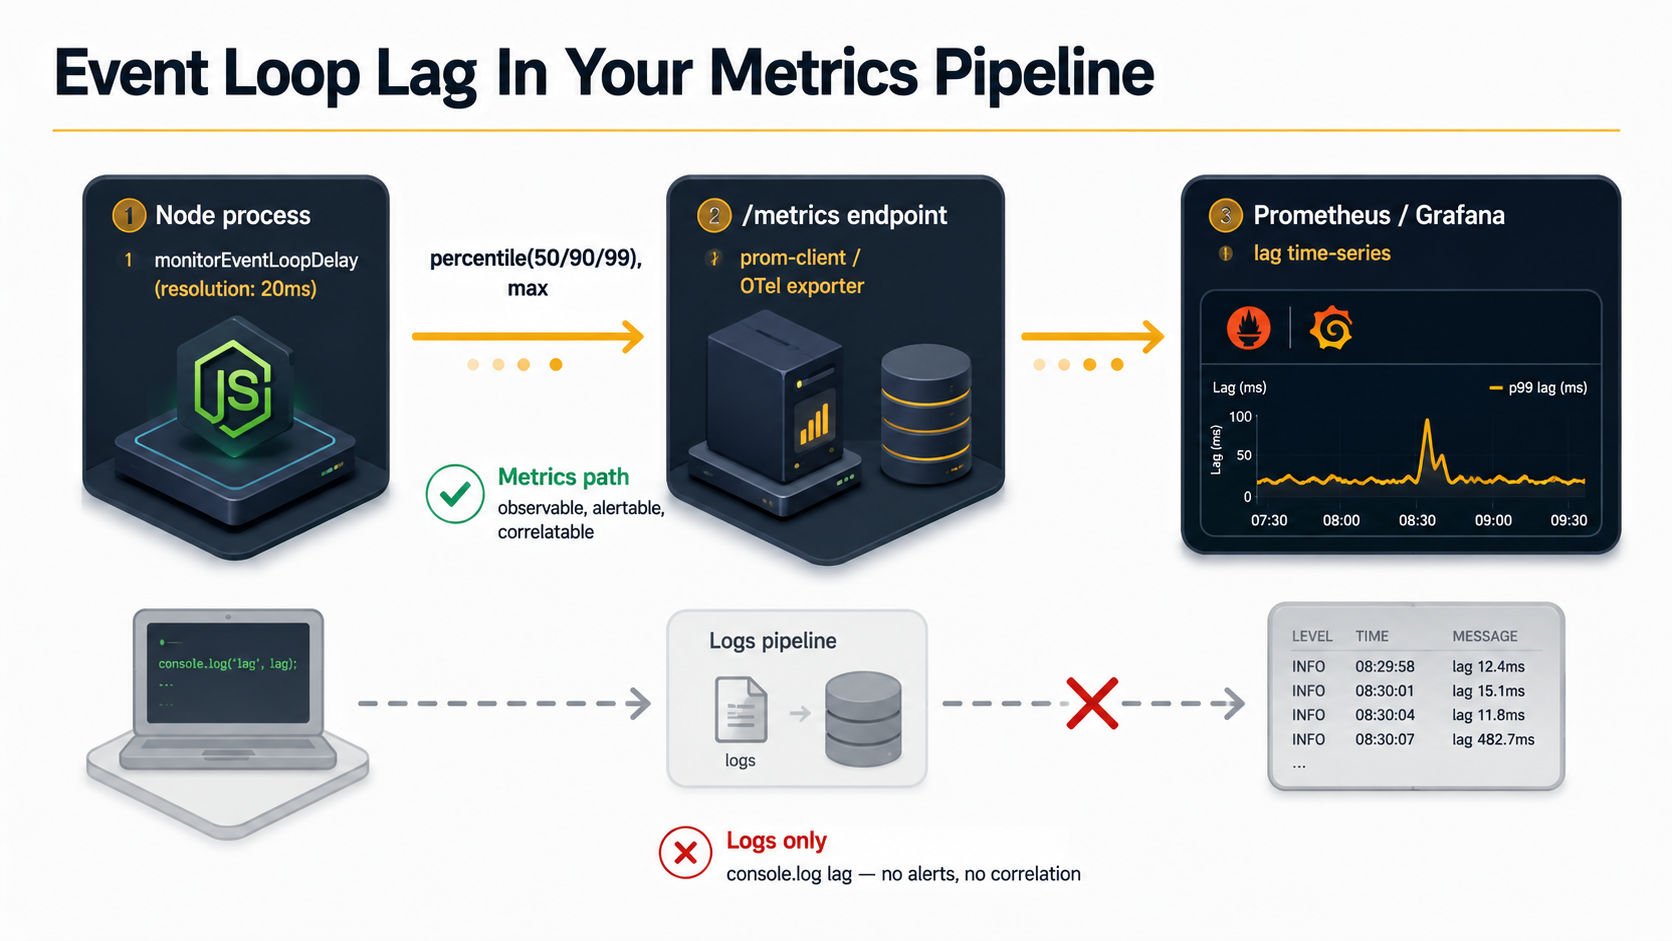
This is enough to print lag to a log every few seconds. It's not enough to monitor it in production, because logs aren't where alerts live. Lag has to make it into your metrics pipeline.
Exposing Lag As A Metric
If you're running Prometheus (or anything that scrapes a /metrics endpoint), wire the histogram into your registry. The prom-client library makes this almost a one-liner: give each gauge a collect() hook that reads the histogram at scrape time, and reset the window on a timer so each scrape sees fresh numbers.
import { Registry, Gauge, collectDefaultMetrics } from 'prom-client';
import { monitorEventLoopDelay } from 'node:perf_hooks';

export const registry = new Registry();
collectDefaultMetrics({ register: registry });

const histogram = monitorEventLoopDelay({ resolution: 20 });
histogram.enable();

// prom-client calls each gauge's collect() while it serializes /metrics, with
// `this` bound to the gauge, so the value is read straight from the histogram
// at scrape time. No manual "update before scrape" wiring needed.
new Gauge({
  name: 'nodejs_event_loop_lag_p50_seconds',
  help: 'Event loop lag p50 over the scrape window',
  registers: [registry],
  collect() {
    this.set(histogram.percentile(50) / 1e9);
  },
});
new Gauge({
  name: 'nodejs_event_loop_lag_p99_seconds',
  help: 'Event loop lag p99 over the scrape window',
  registers: [registry],
  collect() {
    this.set(histogram.percentile(99) / 1e9);
  },
});
new Gauge({
  name: 'nodejs_event_loop_lag_max_seconds',
  help: 'Event loop lag max over the scrape window',
  registers: [registry],
  collect() {
    this.set(histogram.max / 1e9);
  },
});

registry.setDefaultLabels({ service: process.env.SERVICE_NAME ?? 'unknown' });

// Reset the window on a timer rather than inside collect(): collect() runs once
// per gauge per scrape, so resetting there would wipe the histogram between the
// p50 read and the p99 read. A period a little longer than your scrape interval
// keeps each scrape reading a recent window. .unref() so it never holds the
// process open.
setInterval(() => histogram.reset(), 60_000).unref();
A couple of things to notice. The Prometheus convention is seconds, not milliseconds, which is why this version divides by 1e9 instead of 1e6. And prom-client already exposes event loop lag through collectDefaultMetrics: both a point-in-time nodejs_eventloop_lag_seconds and percentile gauges like nodejs_eventloop_lag_p99_seconds. The custom gauges above earn their place by giving you a window you control (the timed reset()) and names that won't collide with the defaults, which matters when traffic is bursty and you want the percentiles to reflect recent load rather than the whole process lifetime.
If you're on OpenTelemetry, the shape is similar: register an observable gauge, update it on each export, reset the histogram in the same callback.
import { metrics } from '@opentelemetry/api';
import { monitorEventLoopDelay } from 'node:perf_hooks';

const meter = metrics.getMeter('nodejs-runtime');
const histogram = monitorEventLoopDelay({ resolution: 20 });
histogram.enable();

meter.createObservableGauge('nodejs.event_loop.lag.p99', {
  description: 'Event loop lag p99 in seconds',
  unit: 's',
}).addCallback((result) => {
  result.observe(histogram.percentile(99) / 1e9);
  histogram.reset();
});
The shape doesn't matter much. What matters is that lag ends up as a time series next to your other RED metrics, so you can correlate a lag spike with a deploy, a traffic pattern, or a noisy neighbour on the host.
What Numbers Actually Mean
Once lag is a metric, you need to know what's healthy. The rough scale, for a typical HTTP/JSON service:
| p99 lag | Meaning |
|---|---|
| under 5ms | Idle or barely used. Nothing to worry about. |
| 5-15ms | Normal under load. The loop is busy, but everything is moving. |
| 15-50ms | Something is doing real synchronous work. Worth looking at. |
| 50-200ms | Users are feeling it. Specific handlers are likely blocking. |
| 200ms+ | Outage-class. Requests are being abandoned somewhere upstream. |
These ranges aren't universal. A service doing legitimate CPU work (image processing, PDF rendering, a heavy crypto step) will sit higher and that's fine. The actual signal is change. A service that normally runs at p99 lag of 8ms and suddenly sits at 80ms has a story to tell, regardless of where that 80ms falls on the absolute scale.
Alerting On Lag
The mistake most teams make is alerting on a single spike. Lag is bursty by nature: a flame graph generation, a one-off large request, GC kicking in. A 200ms spike that lasts two seconds is not the same as 200ms sustained for ten minutes.
The Prometheus shape that actually works looks something like this:
groups:
  - name: nodejs-event-loop-lag
    rules:
      - alert: EventLoopLagHigh
        expr: avg_over_time(nodejs_event_loop_lag_p99_seconds[5m]) > 0.05
        for: 5m
        labels:
          severity: warning
        annotations:
          summary: "Event loop p99 lag above 50ms for 5+ minutes on {{ $labels.service }}"
          runbook: "https://internal.example.com/runbooks/event-loop-lag"

      - alert: EventLoopLagCritical
        expr: avg_over_time(nodejs_event_loop_lag_p99_seconds[2m]) > 0.2
        for: 2m
        labels:
          severity: page
        annotations:
          summary: "Event loop p99 lag above 200ms on {{ $labels.service }} — likely user impact"
Two thresholds, each with a sustained window. The warning fires on something that's worth looking at the next business day. The page fires on something that's actively hurting users. Avoid a third tier: three thresholds always devolves into "everyone ignores the middle one."
The other rule worth following: page on lag separately from latency. If you only alert on latency, every database hiccup and upstream slowdown wakes someone up, and lag tells you nothing about those. A lag alert specifically tells you "Node itself is stuck," which usually points at a different fix than "the upstream is slow."
What You'll Actually Find When Lag Spikes
The instrumentation gets you to the symptom. The interesting part is the causes, and after enough postmortems, you start to recognise the same shapes over and over.
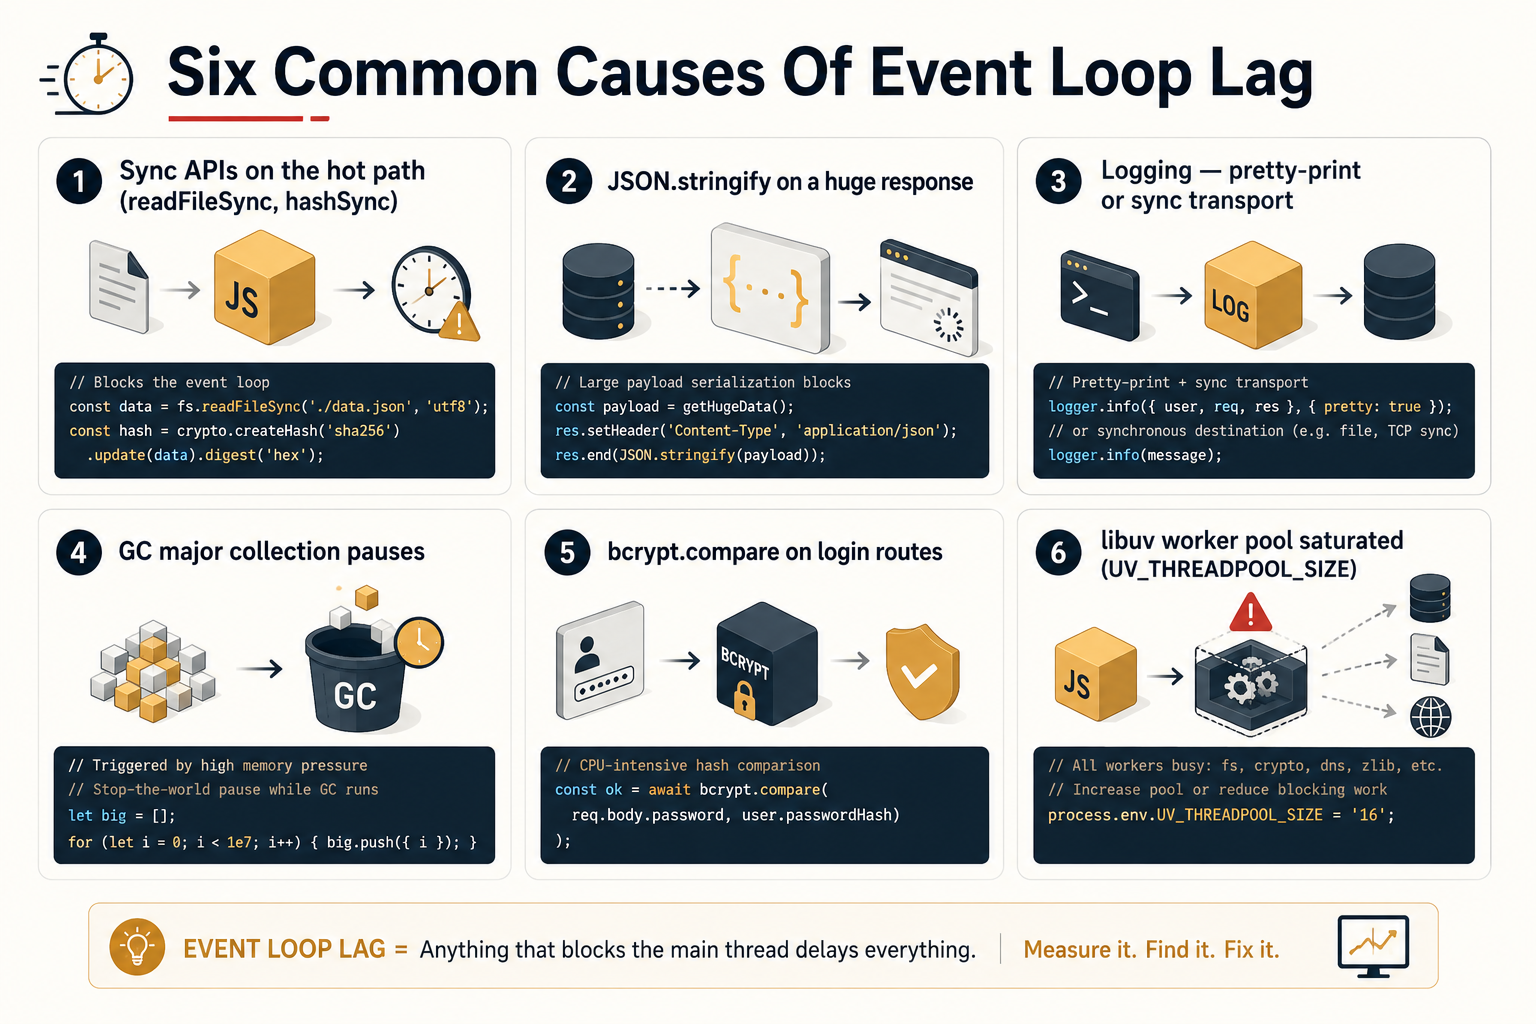
A synchronous library you didn't think was synchronous. Anything ending in Sync (fs.readFileSync, bcrypt.hashSync, zlib.gzipSync) on the request path is the easy version of this. The harder version is a library that looks async (returns a promise, has await in its signature) but is doing CPU-heavy work in the middle of its implementation. A regex on a large string. A JSON.parse of a 10MB body. A schema validator over a deeply nested object. The async wrapper doesn't help; the CPU work still runs on the main thread.
JSON.stringify on a large response. A surprisingly common one. The endpoint returns a 5MB payload, the serializer holds the loop for 80ms per request, and once concurrency rises, every other request behind it sees that as added lag. Streaming the response or paginating the data both fix it; "make the library faster" doesn't.
Logging. A logger configured to format and serialize on the hot path (pretty-printing in production, deep object cloning before write, synchronous file transports) shows up as lag. Pino with its default async transport, or any logger writing to stdout with the OS handling the rest, is fine. A custom transport that formats every field is not.
Garbage collection pauses. Node's V8 garbage collector can hold the loop for tens of milliseconds during a major collection on a memory-pressured process. You'll see this as periodic spikes: lag stays low, lag stays low, then jumps for one sample and goes back. If the spikes correlate with nodejs_gc_duration_seconds (also exposed by prom-client's default metrics), GC is your story. Usually means the process is retaining too much; a heap snapshot from --heap-snapshot-near-heap-limit is the next step.
Crypto and password hashing. bcrypt.compareSync on a login route is a classic. Even the async variants are CPU-bound. bcrypt.compare is still going to use your main thread unless you've configured the library to use a worker thread pool. For a service that handles many logins per second, this alone can dominate lag.
A misconfigured worker pool. libuv has a thread pool, and certain operations (file system reads on some platforms, DNS lookups, crypto in some configurations) use it. If the pool is saturated (default size is 4), those operations queue up, and the queue tail shows as lag from the main loop's perspective. UV_THREADPOOL_SIZE=16 is a knob worth knowing about, though changing it without measuring is the same mistake in a different costume.
Pair Lag With One More Signal
Lag is the headline, but it's clearer when you pair it with one of two correlating metrics:
Active request count. If lag goes up while concurrency goes up, you've found load. The fix is either scaling or making each handler faster. If lag goes up while concurrency is flat, something inside the process is misbehaving, likely one of the causes above.
GC duration. If lag and nodejs_gc_duration_seconds track together, garbage collection is your story. The fix is usually retaining less, not "make GC faster." You can't.
These two together turn lag from "something's slow" into a triage decision in under a minute. Without them, you're still in the dashboard wondering which way to start digging.
A Note On setImmediate Loops
You'll see one alternative pattern in older code or quick scripts:
let lastCheck = Date.now();
setInterval(() => {
  const now = Date.now();
  const lag = now - lastCheck - 1000; // expected 1000ms cadence
  console.log({ lag_ms: lag });
  lastCheck = now;
}, 1000);
This works in the same spirit (measure how late a timer fires) but it's much coarser, only gives you one sample per interval, and isn't a histogram. For ad-hoc debugging on a developer machine, it's fine. For production monitoring, use monitorEventLoopDelay. The cost difference is negligible, the data quality is much better.
The Habit Worth Building
Adding the metric takes maybe twenty minutes. Adding the alert takes another twenty. The real work, and the part that pays off across an engineering career, is making event loop lag part of the dashboard you check first when something is off. Not the database. Not the CPU graph. Not the latency p99. The Node process's own honest report of whether it's keeping up.
A service whose lag is low and whose latency is high is telling you the problem is somewhere else: a slow upstream, a saturated database pool, the network. A service whose lag is high is telling you the problem is inside, and no amount of horizontal scaling will fix it until you find the synchronous work and move it off the main thread.
That's the entire value of monitoring it in production. Not the number itself: the direction it points.