It's 3:14am. Your phone is buzzing. The checkout service that handled 800 requests per second yesterday is now timing out at 200. The CPU graph in Grafana looks fine: 40%, flat. Memory is "normal". Nothing looks broken. And yet p99 latency went from 60ms to 4 seconds.
This is the moment you find out whether you actually know how to profile Node.js in production, or whether you've been pasting console.time everywhere and calling it observability.
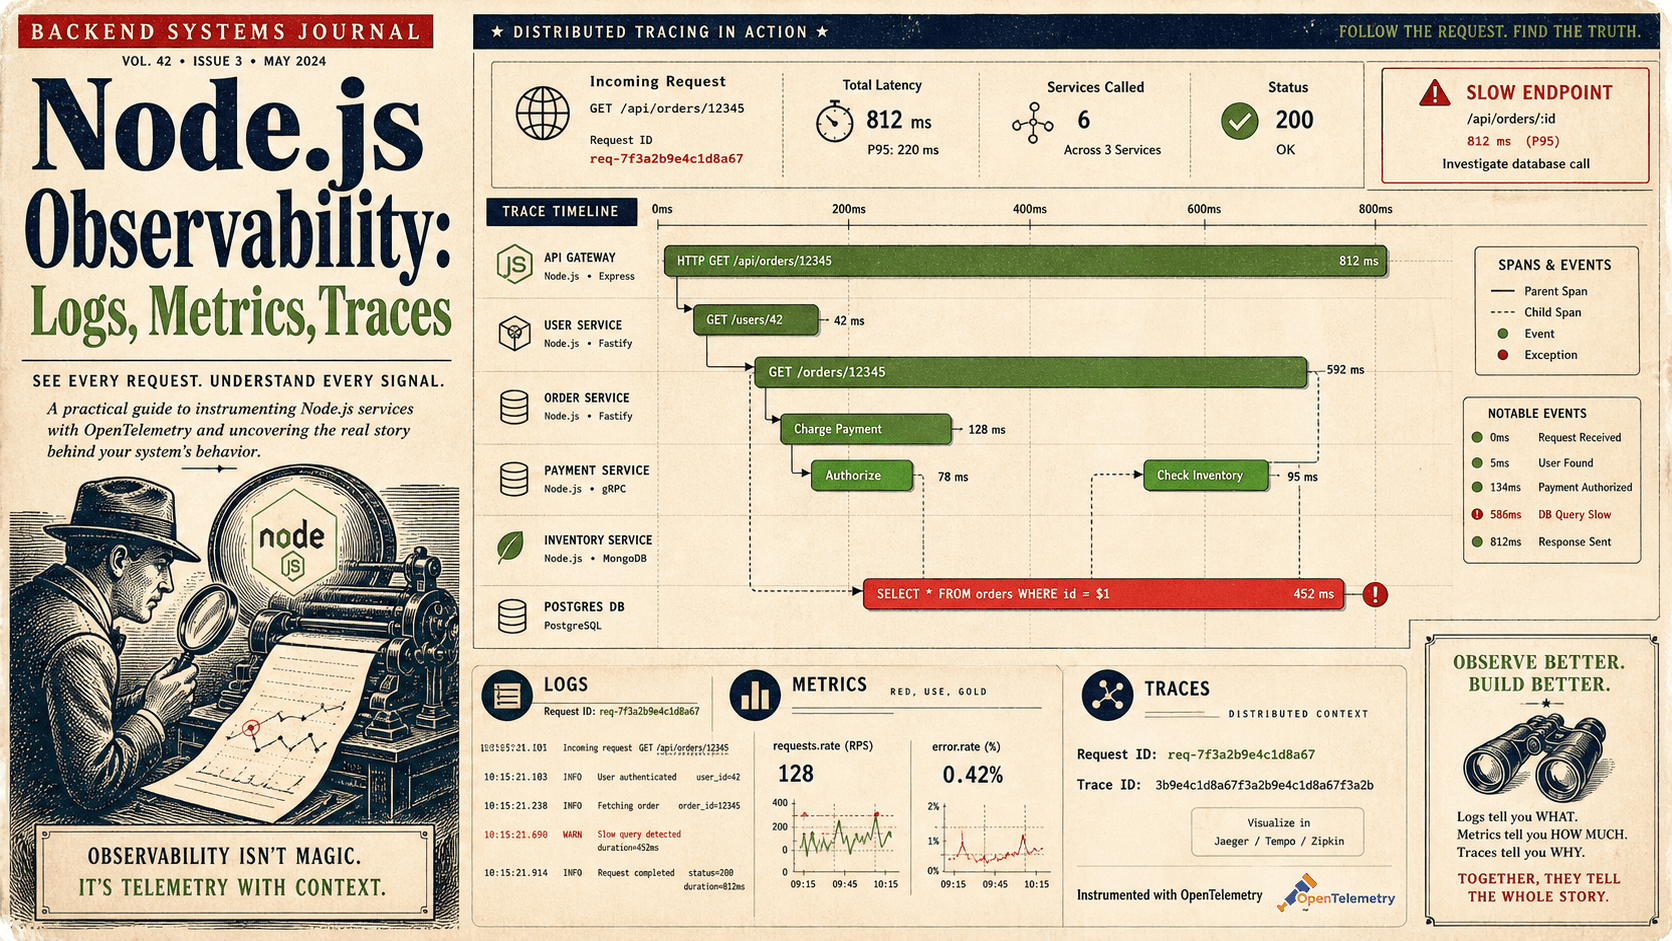
Let's go through it properly. Not the hello-world version where you profile a Fibonacci function on your laptop, but the version that works on a live service: how to capture a CPU profile, how to read a flamegraph without fooling yourself, how to take a heap snapshot and find the leak instead of the noise, and how to measure event loop lag, which is the single most important Node-specific metric you're probably not graphing.
What "profiling" actually means in Node
When people say "profile this Node service", they usually mean one of four very different things, and the first job is to figure out which one you actually need.
- CPU profiling: which JavaScript functions burned the most CPU in a sample window? This is sampling-based: V8 stops the world a few hundred times per second and records the JS stack. Cheap, low-overhead, and the right answer when "the box is hot".
- Heap profiling and heap snapshots: which objects are alive, who is keeping them alive, and how does that set grow over time? The right answer when "memory keeps climbing" or "we OOM every 6 hours".
- Flamegraphs: a visualisation of stack samples (CPU or otherwise), not a separate kind of profile. You'll hear "flamegraph" and "CPU profile" used interchangeably. They're not the same thing: one is the data, one is how you look at it.
- Latency / event loop analysis: is the loop itself blocked, and if so, by what? Node is single-threaded for JS execution. If the loop spends 80ms in one tick, every request sitting in the queue eats that 80ms whether your handler is fast or not. This is where most "the CPU graph looks fine but everything is slow" bugs live.
The bug above, flat CPU and exploding p99, is almost always one of: a synchronous handler doing too much work per tick, GC pauses long enough to be visible, or the libuv thread pool saturated (default size: 4 threads, controlled by UV_THREADPOOL_SIZE). None of those show up as "100% CPU". All of them show up as event loop lag.
CPU profiling: the cheapest tool in the box
Node ships with two ways to capture a CPU profile that you should know cold.
The --cpu-prof flag
The simplest one. Start your process with the flag, do the work you want to profile, and stop the process:
node --cpu-prof --cpu-prof-dir=./profiles server.jsWhen the process exits, Node writes a CPU.<timestamp>.<pid>.<tid>.<seq>.cpuprofile file into ./profiles. You can also control sampling resolution with --cpu-prof-interval=<microseconds> (default 1000, i.e. 1ms, about 1000 samples per second per worker).
That file opens directly in Chrome DevTools. Drop it into a Chrome tab on chrome://inspect, click Open dedicated DevTools for Node, go to the Performance tab, Load profile, and you've got the flamegraph and a sortable function-cost table in 30 seconds. Same file works in VS Code's built-in profile viewer.
This is great for "I can reproduce the slow code path on a workload generator". It's bad for production, because you need to restart the process to start capturing, and you only get the profile when the process exits.
The Inspector API: profile a running process
The programmatic version, which is what you actually want in production:
const inspector = require('node:inspector/promises');
const fs = require('node:fs/promises');

async function captureCpuProfile(durationMs = 30_000) {
  const session = new inspector.Session();
  session.connect();

  await session.post('Profiler.enable');
  await session.post('Profiler.start');

  await new Promise((r) => setTimeout(r, durationMs));

  const { profile } = await session.post('Profiler.stop');
  await fs.writeFile(`./cpu-${Date.now()}.cpuprofile`, JSON.stringify(profile));

  session.disconnect();
}
You can wire this to a route, a signal handler, or an admin-only IPC channel. The trick is that you can capture a profile from a running process at the moment it's misbehaving: no restart, no synthetic workload, no "I tried to reproduce it locally and couldn't".
A pattern that has saved me embarrassment more than once: bind it to SIGUSR2. When p99 spikes, you kill -USR2 <pid> on the box (or have your platform do it for you), and a cpu-<timestamp>.cpuprofile lands on disk. Read it later, in Chrome, on a laptop, with coffee.
Reading a flamegraph without fooling yourself
The flamegraph is the standard way to look at a CPU profile, and it is dense with information that's easy to misread.
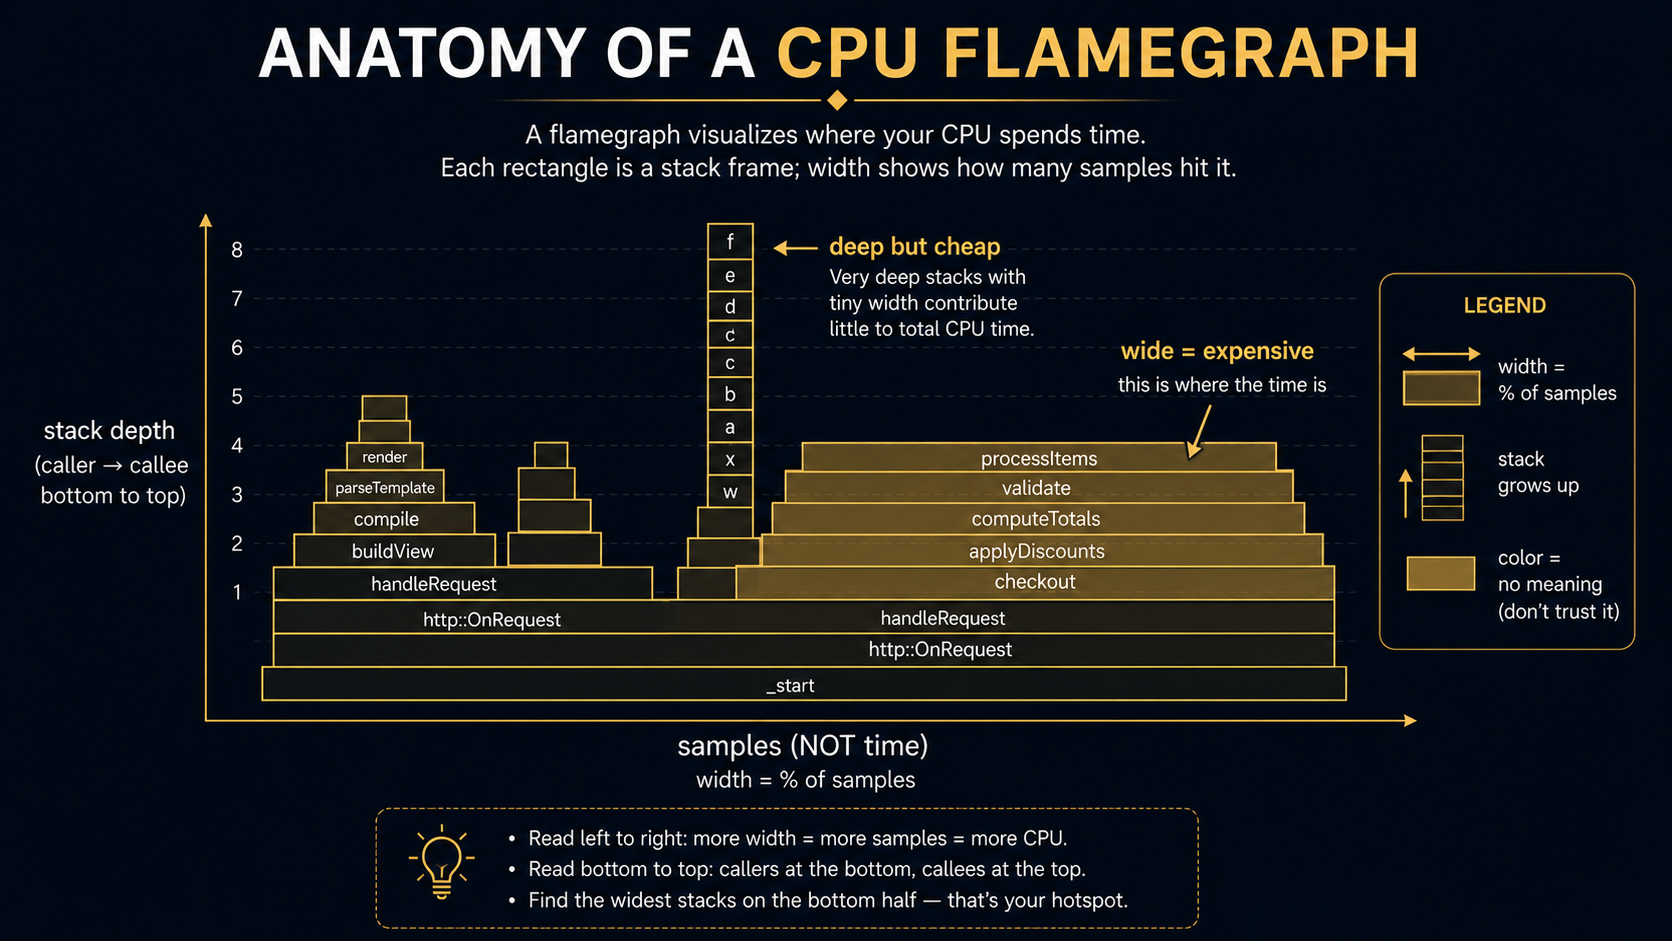
The two rules to keep in your head:
- Width is what matters. Height is not. A tall, narrow tower means a deep call stack: interesting structurally, but it didn't cost you anything. A wide rectangle means this function was on the stack in a lot of samples. That's where the time went.
- Width includes children. A wide function may be wide because it is slow, or because something it calls is slow. To find the actual hot frame, look at the top of the wide tower, the bit with no children above it. That's where CPU was actually being spent at sample time, not somewhere up the call chain.
Two things that look like signal but usually aren't:
- A wide bar labelled
(idle)or(program): this is V8 telling you it took samples while the JS engine had nothing to do. On an I/O-bound service this can be 90% of the profile and means nothing. Filter it out, or capture during a known-busy window. - A wide bar labelled
(garbage collector): that is signal. If GC is eating 20% of samples, you don't have a CPU bug, you have an allocation bug. Stop reading the flamegraph and go to heap profiling.
The 0x and clinic flame tools
For ad-hoc local profiling, 0x (by David Mark Clements) and clinic flame (by NearForm, built on top of 0x) wrap all of the above and produce a self-contained interactive flamegraph as an HTML file you can share. Both can attach to a running process or wrap a node invocation. They're the right tool for "I'm investigating on my laptop with a workload generator" and the wrong tool for "I need to grab a profile from production at 3am without changing how the process starts".
Heap snapshots and the leak that compounds
CPU profiles tell you where time went. Heap snapshots tell you where memory went.
A heap snapshot is exactly what it sounds like: a frozen dump of every object V8 is holding, with pointers to who's holding what. They're big (often hundreds of MB for a real service), slow to take (the process pauses for the duration, usually 1 to 10 seconds for a multi-GB heap), and enormously useful when used right.
Take a snapshot from anywhere
Node has had v8.writeHeapSnapshot() built in for years now. No npm package needed:
const v8 = require('node:v8');

function dumpHeap() {
  const file = `./heap-${Date.now()}.heapsnapshot`;
  v8.writeHeapSnapshot(file);
  return file;
}
Bind that to SIGUSR2, an admin route, or a CLI signal, same pattern as the CPU profile. Drop the .heapsnapshot file into Chrome DevTools, Memory tab, Load.
The three-snapshot technique
The single most useful technique for finding a memory leak in Node, and the one nobody tells you about until you've already wasted a day on it:
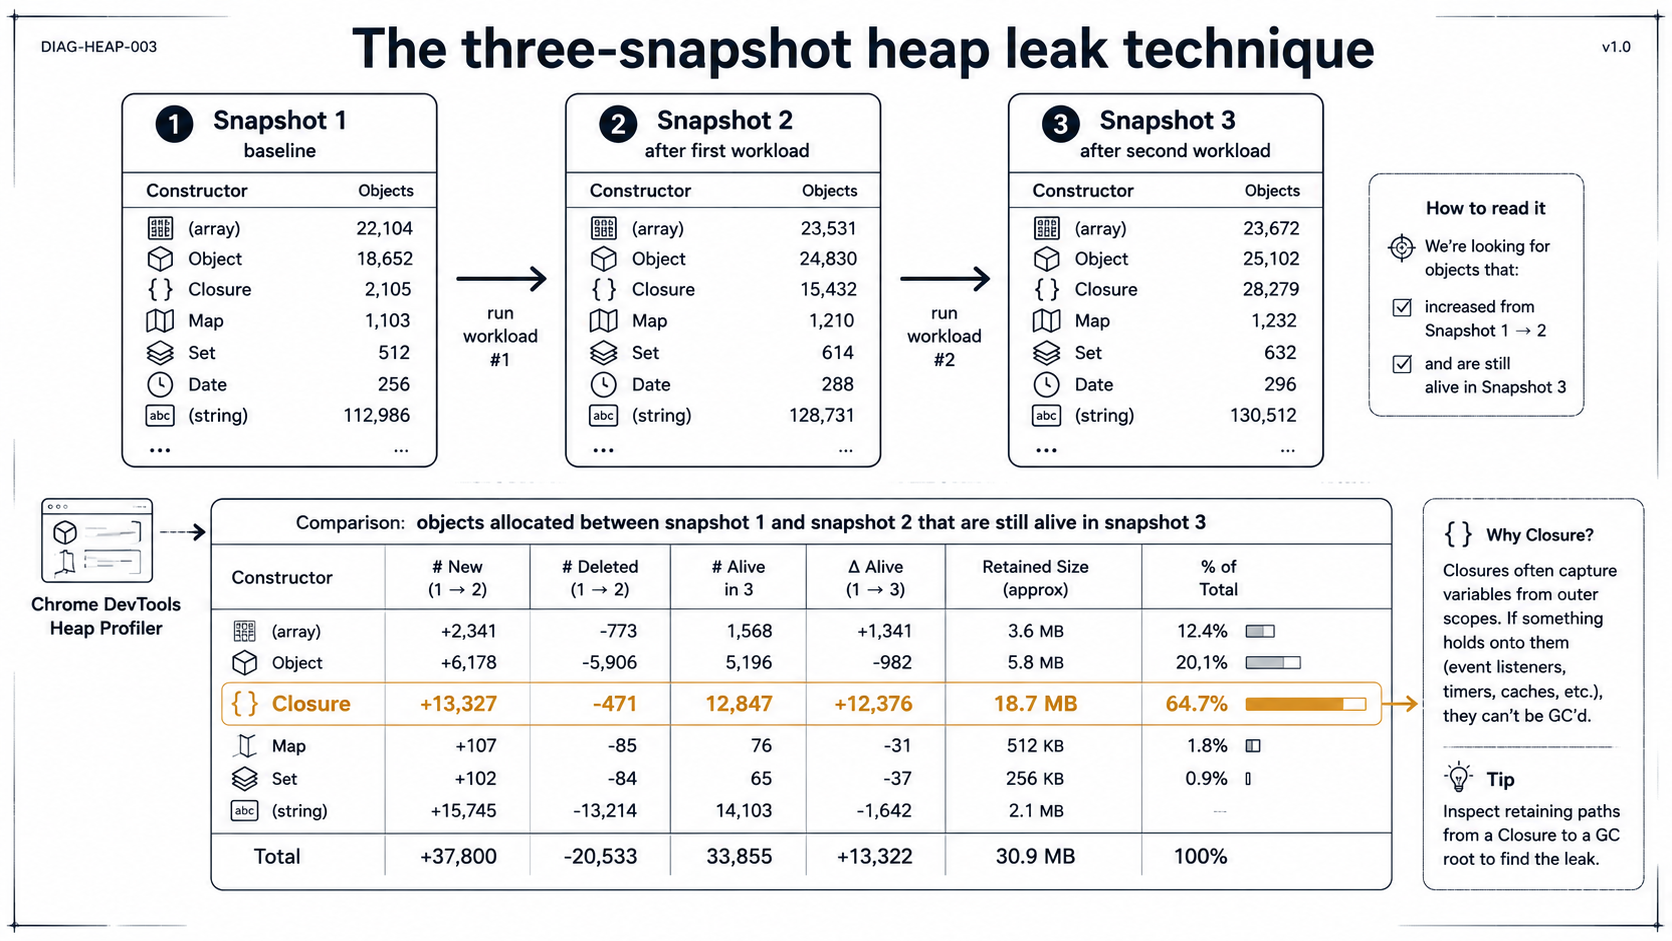
- Boot the process. Let it reach steady state. Take snapshot 1.
- Run a chunk of representative work (e.g., 10,000 requests through your slow endpoint). Let GC settle for a few seconds. Take snapshot 2.
- Run the same chunk of work again. Let GC settle. Take snapshot 3.
Now load all three into Chrome DevTools and switch to Comparison view, comparing snapshot 3 to snapshot 1. The trick: anything allocated between snapshot 1 and snapshot 2 that's still alive in snapshot 3 is, by definition, not transient. That's your leak candidate. Sort by Delta or Retained Size and start at the top.
The Chrome heap viewer has four columns that confuse everyone the first time:
- Shallow Size: the memory this object directly occupies, not counting what it points to.
- Retained Size: the memory that would be freed if this object were collected, counting everything only this object keeps alive. This is the column you sort by when leak-hunting.
- Distance: how many pointer hops from the GC root. Useful for "why is this still alive?".
- Constructor: the class name.
(closure),(array),(string),(system)are special V8 buckets.
The leak pattern you'll see 80% of the time is one of:
- A
Mapor object used as a cache that never evicts. - An array of event listeners on a singleton that something keeps
.push-ing onto. - Closures captured by a long-lived emitter or timer that hold a reference to a request-scoped object.
- A pinned
Buffer(anexternalallocation) that's logically dead but no one nulled the reference.
The closure case is the one that bites the most. If your Constructor column has tens of thousands of (closure) entries growing between runs, find what's emitting them. Usually it's someEmitter.on('event', () => { ... }) inside a request handler, and someEmitter lives forever.
Heap profiling (sampled, not snapshotted)
If snapshots are too heavy (and at multi-GB heap sizes they often are), Node also supports sampled heap profiling, the same way it does CPU. The --heap-prof flag:
node --heap-prof --heap-prof-dir=./profiles --heap-prof-interval=524288 server.jsThis samples allocations (roughly one sample per --heap-prof-interval bytes, 512KB in the example above). On exit you get an .heapprofile file that opens in Chrome DevTools and shows you which call sites allocated the most memory over the lifetime of the process. It's the allocation-side counterpart to a CPU profile: not "what's alive now" but "what created memory pressure".
This is the right tool when GC is wide in your CPU flamegraph and you want to know who's making it work so hard. Snapshots tell you what stuck around. Heap profiles tell you what got allocated in the first place.
Event loop lag: the metric you should already be graphing
Of every metric on this list, this one matters most for "users notice slowness", and it's the one almost nobody graphs by default.
Event loop lag is the time between when a tick should have run and when it actually did. If the loop is unblocked, lag is sub-millisecond. If something is hogging the loop, whether a synchronous JSON parse on a 50MB payload, a CPU-heavy regex, a long GC pause, or a sync FS call, lag spikes, and every request behind it eats that lag.
Node has a native histogram for this in perf_hooks:
const { monitorEventLoopDelay } = require('node:perf_hooks');

const h = monitorEventLoopDelay({ resolution: 20 });
h.enable();

setInterval(() => {
  console.log({
    min: h.min / 1e6,        // ns → ms
    mean: h.mean / 1e6,
    p99: h.percentile(99) / 1e6,
    max: h.max / 1e6,
    stddev: h.stddev / 1e6,
  });
  h.reset();
}, 5_000);
resolution is how often Node checks; 20ms is a sensible default, and smaller means more overhead. The histogram tracks how late each scheduled tick was. Ship the percentiles to your metrics backend with whatever you already use (Prometheus, Datadog, OTel all have a histogram type that maps to this directly).
A healthy Node service running below saturation will show p99 lag in the single-digit milliseconds. When you see p99 lag at 200ms+, your service is functionally broken even if CPU and memory look healthy, and this is what was happening in our 3:14am scene at the top. Latency wasn't being created in your handlers. It was being created in the gap between scheduling a handler and getting to run it.
What blocks the loop, in order of how often I've seen it
- Sync JSON / crypto / compression on large payloads.
JSON.parseon 30MB of input is dozens of milliseconds. Move it to a worker thread or stream-parse. - Long GC pauses. Show up as wide
(garbage collector)blocks in a flamegraph and as event-loop-lag spikes. Usually a symptom of allocation pressure, not GC tuning. - A regex with catastrophic backtracking on user input. Always faster than you expect, until the input is adversarial, and then it freezes the process for seconds.
- The libuv thread pool is saturated.
fs.readFile, DNS lookups, and crypto primitives likepbkdf2all use the pool. Default size is 4. If your service does heavy crypto under load, bumpUV_THREADPOOL_SIZEand watch loop lag drop. - Sync FS calls in hot paths.
fs.readFileSync,fs.existsSync. Find them with a CPU profile: they show up as wide bars in the user code path and they cannot be hidden.
A note on overhead, and when to leave it on
The thing that scares people away from running any of this in production is "won't the profiler slow my service down?" Approximately:
monitorEventLoopDelay: negligible. Single-digit microseconds per tick at 20ms resolution. Leave it on permanently.- V8 CPU profiler (sampling at 1ms): in the low single-digit percent CPU overhead range for most workloads. Fine to run for short bursts (30 to 60s) on demand; I would not leave it on 24/7 on a hot service.
v8.writeHeapSnapshot(): stops the world for seconds on large heaps. Never run blindly on a serving node.--heap-prof(sampled): similar overhead profile to CPU profiling. Fine for short bursts.
The pattern that scales: monitor event loop lag continuously, alert on sustained p99 > 50ms, and have signal handlers wired to capture a CPU profile and a heap snapshot on demand. When the alert fires, you grab both artifacts from the misbehaving instance, drain it from the load balancer, and read the files at your leisure. That's it. That's the whole production profiling workflow most teams need.
The 3am alert you actually want to receive isn't "the service is down". It's "event loop lag p99 is 380ms, I captured cpu-1716039240.cpuprofile and heap-1716039241.heapsnapshot, here's the S3 link". Build that one thing, and most of the war stories in this article become 20-minute investigations instead of all-nighters.