Most Node.js performance "fixes" I have seen ship to production are guesses. Someone read a blog post about worker_threads, someone else suggested clustering, a third person added an in-memory cache. The latency chart did not move, but the codebase got a little harder to reason about.
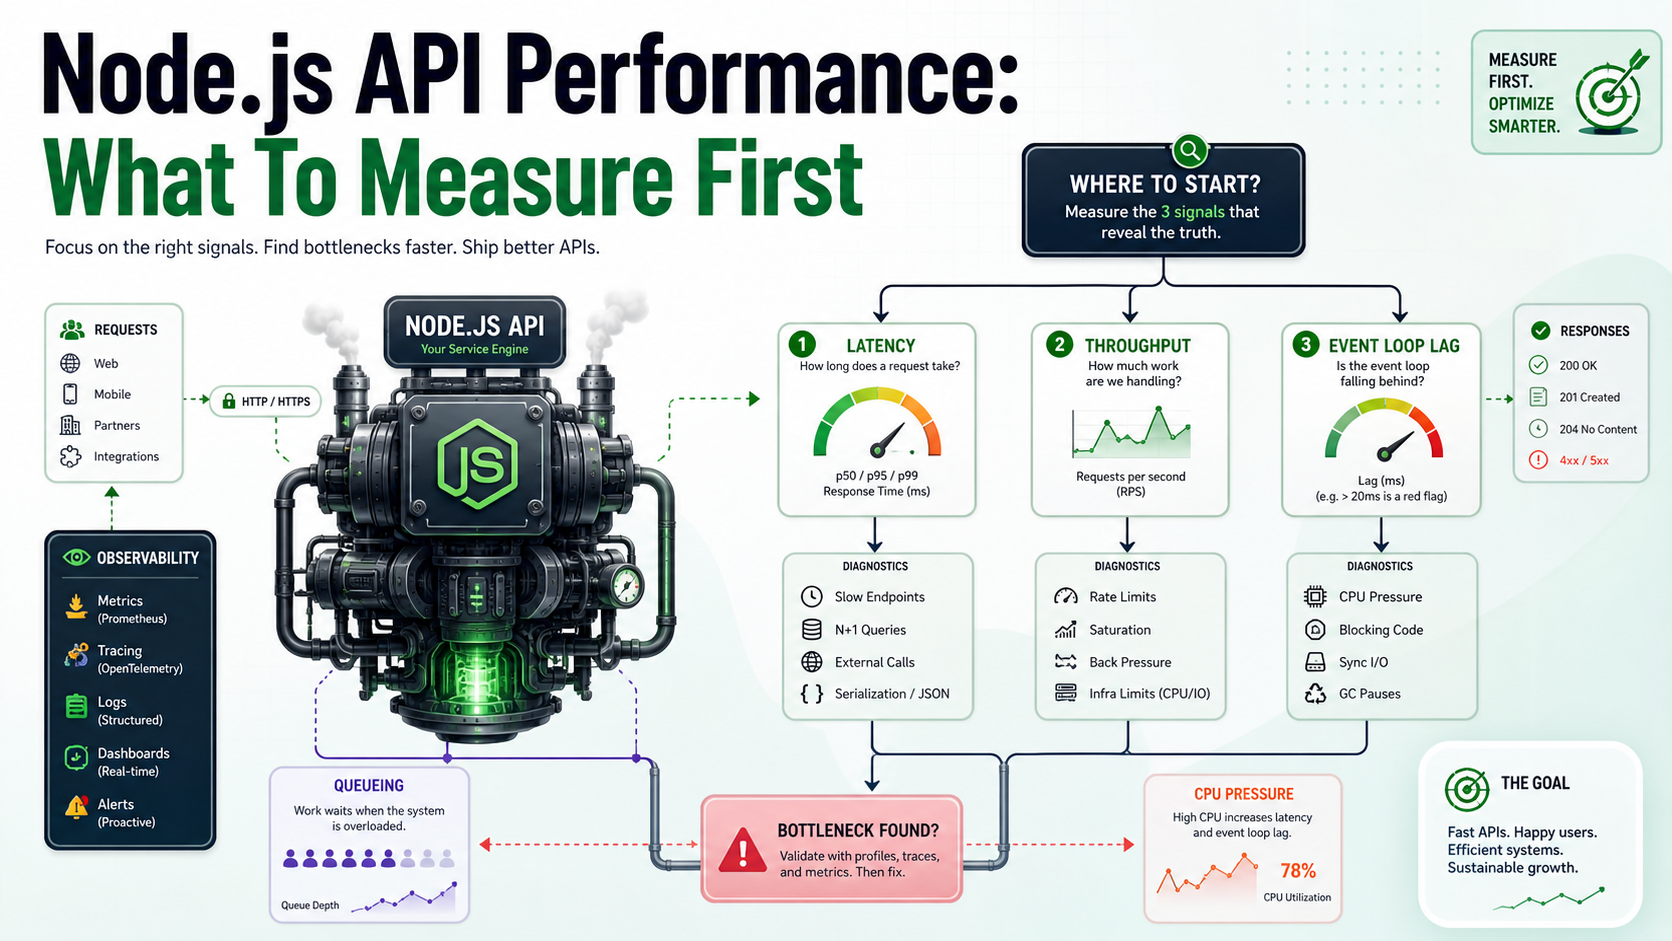
Performance work that pays starts with measurement. Not "feels slow." Numbers. A p99 latency, an event loop lag chart, a flame graph showing where the CPU actually spends its time. Without that, every fix is a coin flip.
The good news: Node.js has excellent tools for this, almost all of them free, almost all of them runnable on a laptop in an afternoon. Here is the order I work through them.
Start With Latency Percentiles, Not Averages
The single most useful number is the p99 latency of your busiest endpoint. The average will hide everything that hurts users. A request that takes 50ms on average and 4 seconds at p99 is a request that loses customers; the average tells you nothing about that.
autocannon is the right starting tool. It is fast, easy to run from the command line, and reports the percentiles you need:
npx autocannon -c 100 -d 30 -p 10 http://localhost:3000/api/productsThat runs 100 concurrent connections for 30 seconds with 10 pipelined requests per connection. The output gives you req/sec, latency p50/p75/p90/p99, and the histogram. Run it against your endpoint, write down the numbers, and now you have a baseline. Every change you make either moves these numbers or it does not.
A few practical notes:
- Run autocannon against a build that mirrors production (
NODE_ENV=production, real DB, real network). Local dev numbers are theatre. - Disable colorful console logging during the run;
console.logis synchronous and will skew results. - Run for at least 30 seconds. The first few seconds include JIT warmup and pool ramp-up.
Event Loop Lag Tells You If Node Itself Is The Problem
Node is single-threaded. If your handlers do too much synchronous work — JSON.parse on a 5MB body, bcrypt.hashSync, a regex on huge text — every other request waits. The signal for this is event loop lag.
Measure it with the built-in perf_hooks:
import { monitorEventLoopDelay } from 'node:perf_hooks';

const h = monitorEventLoopDelay({ resolution: 20 });
h.enable();

setInterval(() => {
  console.log({
    p50_ms: (h.percentile(50) / 1e6).toFixed(2),
    p99_ms: (h.percentile(99) / 1e6).toFixed(2),
  });
  h.reset();
}, 5_000);
Healthy: p99 under 10ms. Concerning: p99 in the tens of ms. Broken: p99 above 100ms. If your event loop lag is high, no amount of database tuning will save you — you have CPU work blocking I/O.
The fixes are different from "make queries faster." Move the heavy work to worker_threads, replace synchronous crypto with the async variants, stream the JSON instead of buffering it. The diagnosis came first.
Profile Where The CPU Actually Goes
When event loop lag points at CPU, you need a flame graph. Two tools:
clinic flame(part ofclinic.js) wraps your process, runs your load test, and produces an interactive flame graph in your browser.npx clinic flame -- node server.js, then run autocannon against it, thenCtrl+C.0xdoes the same job with a slightly different UI. Some teams prefer it; the output is equivalent.
The flame graph reads top-down: each box is a function, width is total time spent there. You are looking for an unexpectedly fat box. Common culprits in a web service: a JSON serializer for a huge response, a regex you forgot was there, a logger formatting fields synchronously, a hash computation per request.
clinic doctor is the orchestration layer above all of this. Run it once and it will tell you which of the four common problems you have — CPU, event loop, garbage collection, or I/O — and which more specific tool to reach for next.
npx clinic doctor -- node server.js
# in another terminal:
npx autocannon -c 100 -d 20 http://localhost:3000/
# Ctrl+C clinic, it opens a report in your browser
Database Time Is Usually The Real Answer
In most web services I have profiled, the bottleneck is not Node — it is waiting on the database. The way you see this is per-route timing that splits "in handler" from "in database." Pino plus a small middleware does the job:
app.use(async (req, res, next) => {
  const start = process.hrtime.bigint();
  let dbMs = 0;
  res.on('finish', () => {
    const totalMs = Number(process.hrtime.bigint() - start) / 1e6;
    req.log.info({ route: req.route?.path, totalMs, dbMs, cpuMs: totalMs - dbMs }, 'request');
  });
  // your DB layer increments dbMs through async_hooks or instrumentation
  next();
});
Once you have that, the conversation changes. "p99 is 800ms, of which 760ms is in the database" tells you exactly where to look — usually a missing index, a SELECT * over a wide table, or an N+1 query. None of those are Node problems.
HTTP Keepalive And Connection Pooling
Two settings that move latency dramatically and most people never touch:
HTTP keepalive on outgoing requests. Modern Node already gets the basics right — http.globalAgent defaults to keepAlive: true since Node 19, and built-in fetch (backed by undici) keeps connections alive in its global dispatcher by default. The lever you actually have is tuning the pool size and timeouts to match your upstream load:
import { Agent, setGlobalDispatcher } from 'undici';

setGlobalDispatcher(new Agent({
  keepAliveTimeout: 30_000,
  connections: 100,
  pipelining: 1,
}));
undici is the HTTP client Node's built-in fetch uses under the hood. The defaults are reasonable; setting an explicit global dispatcher lets you size the pool for high-fanout workloads where the default 5-connection-per-origin cap would queue requests.
Database pool sizing. Covered in the access-patterns article: max per process times replicas should fit under Postgres max_connections. Pool exhaustion shows up as a long tail at p99 and nothing useful in your handler timing — requests are queued for a connection before they ever touch your code.
Cluster Versus worker_threads, Once
If you have measured CPU saturation across cores and your handler is genuinely doing too much synchronous work, now you reach for the multi-process tools.
clusterforks the process per CPU and shares the listening socket. Each worker is a full Node process; memory does not share. Good for horizontally scaling a CPU-bound HTTP server on a single host. PM2 in cluster mode wraps this nicely.worker_threadsruns JavaScript on additional threads inside the same process, withSharedArrayBufferfor shared memory. Right for a specific CPU-heavy job (image resize, PDF generation, hashing) you can hand off from the main loop.child_processis for spawning external commands or other Node scripts entirely. Different tool.
Reach for these after the measurements say you need them. Reaching first is how codebases get complicated for no measurable gain.
A One-Sentence Mental Model
Performance is a triage problem before it is a coding problem — measure latency percentiles, then event loop lag, then database time, and only then fix what the data points at.