There's a question that gets asked at almost every senior Node.js interview, and almost everyone answers it wrong: "What does await actually do between the moment it suspends a function and the moment it resumes?"
The popular answer is some variation of "it yields to the event loop." That's not wrong, exactly. It's just so vague that it's useless. It glosses over the actual mechanism, which is the difference between writing code that hits 5k req/s and code that mysteriously stalls at 400. If you've ever had a setTimeout fire late, a microtask starve a connection, or a CPU-bound task quietly kill your tail latencies, you've already met the event loop. You just haven't been formally introduced.
This piece is the introduction. We're going to walk all the way down: the six phases libuv actually runs, what process.nextTick does that queueMicrotask doesn't, why a 1ms timer can fire after 7ms (or 0ms), and the handful of patterns that turn a healthy Node process into one that pegs a single CPU core while doing nothing useful.
The thing everyone gets half-right
Most explanations start with "Node.js is single-threaded and uses an event loop." That sentence has two errors packed into seven words, and they cause real bugs.
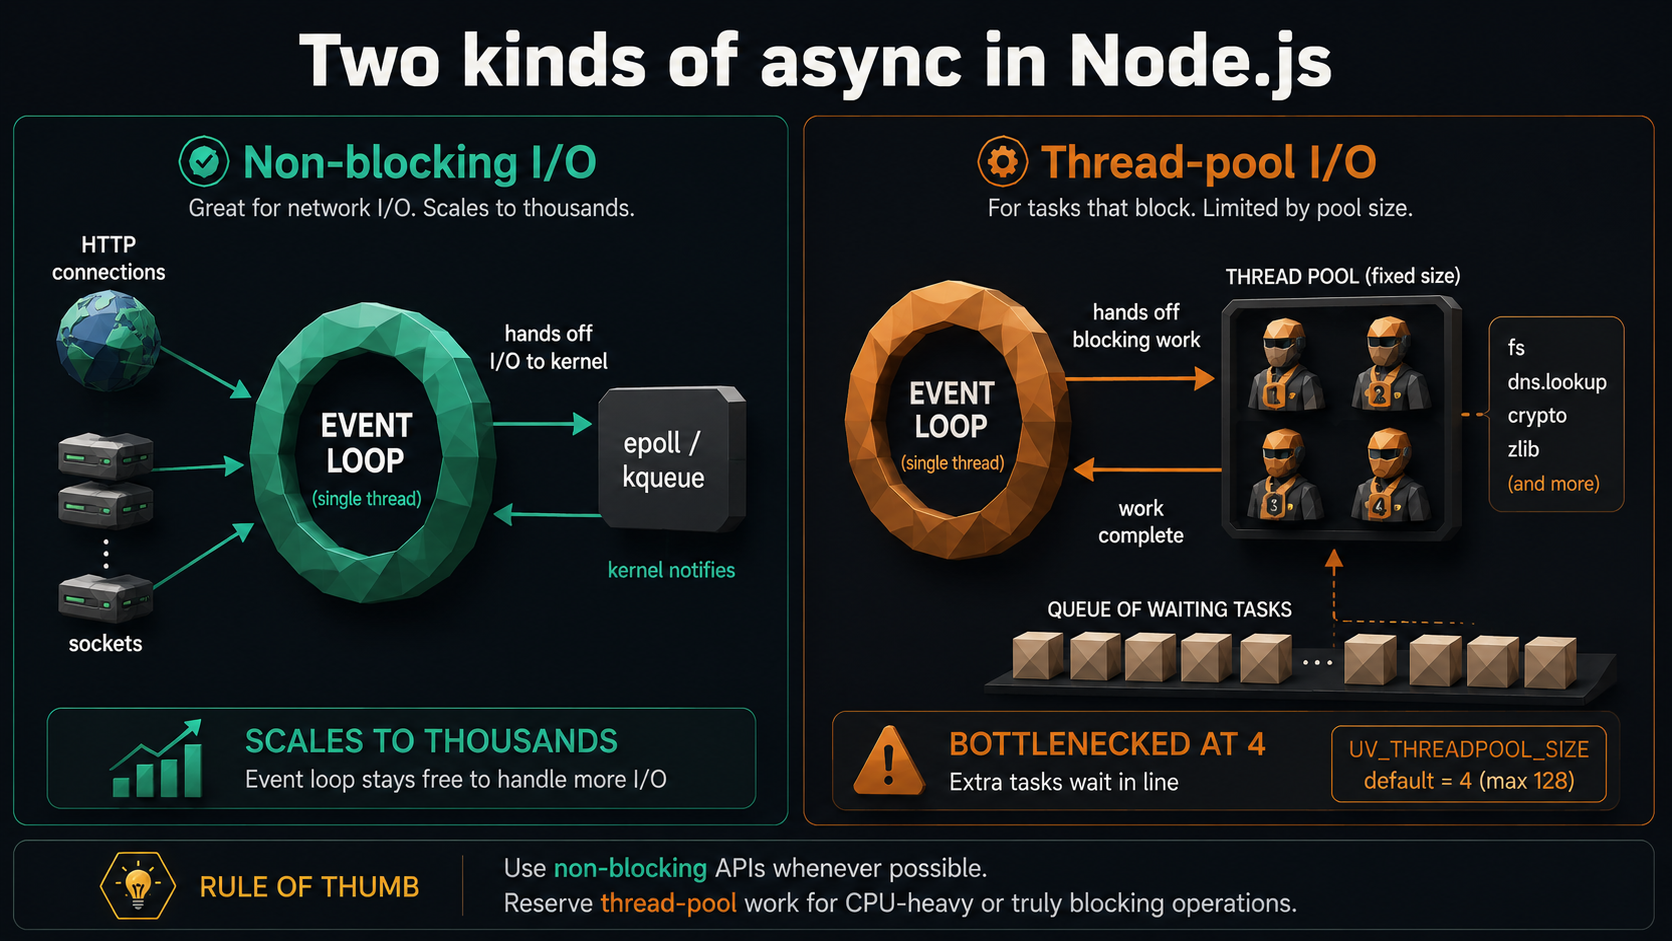
Error one: Node is not single-threaded. The JavaScript you wrote runs on a single thread. Around that thread, libuv spins up a pool of worker threads (by default 4) that handle the things V8 can't do non-blockingly: filesystem operations, DNS lookups (the legacy dns.lookup variant), some crypto, some compression. Bring up htop on a busy Node process and you'll see five threads, not one. Set UV_THREADPOOL_SIZE=16 and you'll see seventeen. Networking is the exception: sockets are non-blocking at the OS level and don't need the pool.
Error two: there isn't an event loop, singular and atomic. There's a loop with six distinct phases, each with its own queue, plus two cross-cutting microtask queues that drain between every other thing that happens. Treating it as one queue is the mental model that produces bugs like "why did my setImmediate run before my setTimeout(fn, 0) sometimes but not others?"
Let's fix both.
The six phases, in the order they actually run
Each tick of the event loop walks through phases in this order. Inside each phase, a FIFO queue of callbacks is drained until either the queue is empty or libuv hits an internal limit. Then we move to the next phase.
   ┌───────────────────────────┐
┌─►│           timers          │ ◄── setTimeout / setInterval callbacks fire here
│  └─────────────┬─────────────┘
│  ┌─────────────┴─────────────┐
│  │     pending callbacks     │ ◄── deferred TCP errors etc.
│  └─────────────┬─────────────┘
│  ┌─────────────┴─────────────┐
│  │       idle, prepare       │ ◄── internal use only
│  └─────────────┬─────────────┘      incoming:
│  ┌─────────────┴─────────────┐      connections,
│  │           poll            │ ◄────data, etc.
│  └─────────────┬─────────────┘
│  ┌─────────────┴─────────────┐
│  │           check           │ ◄── setImmediate callbacks fire here
│  └─────────────┬─────────────┘
│  ┌─────────────┴─────────────┐
└──┤      close callbacks      │ ◄── socket.on('close'), etc.
   └───────────────────────────┘
Six phases. The two you'll care about 95% of the time are poll (where I/O completion callbacks land) and timers (where setTimeout and setInterval fire). Let's take them one at a time.
Timers
setTimeout(fn, 100) does not mean "run fn 100ms from now." It means "run fn no sooner than 100ms from now, the next time we're in the timers phase." Two different guarantees, and the gap is where surprise comes from.
Internally, libuv keeps active timers in a min-heap keyed by expiry time. The smallest element, the timer that should fire next, is always at the root, so peeking it is O(1). When the event loop enters the timers phase, it pops every timer whose expiry has already passed and runs its callback. If you've been blocked in the poll phase for 80ms because a giant JSON parse hogged the thread, every timer that expired during those 80ms gets fired in a single burst the moment we re-enter timers.
That's why setTimeout drifts. The minimum delay is honoured; the maximum isn't bounded by anything except "how busy is the event loop." If you've ever seen "why is my 1-second metric tick actually firing every 1.3 seconds?" in production, that's it. Some other callback was eating the loop.
There's a smaller surprise hiding in the minimum delay too. In the browser, nested timers are clamped to 4ms after a few rounds of nesting. Node doesn't do that. Node's minimum is 1ms, and even that is fuzzy: there are open issues where 1ms timers measured 0ms between schedule and fire. Don't write code that depends on setTimeout(fn, 1) actually delaying anything. If you want to defer a callback to "the next loop turn," that's what setImmediate is for.
Pending callbacks
A small, mostly internal phase. libuv occasionally has to defer the completion of an operation to the next tick. The canonical example is a TCP write that returns EAGAIN (the kernel's "try again later" signal). The retry callback lands here. You almost never write code that targets this phase directly, but knowing it exists explains a few odd traces in the inspector.
Idle, prepare
Internal. Don't touch. Listed for completeness so you can recognise them in profiling output.
Poll: the one that does the heavy lifting
The poll phase is where Node spends most of its time and where most of your application's callbacks actually run. It does two things:
- Drains the queue of completed I/O callbacks (a file read finished, a socket got data, a DNS lookup returned).
- If that queue is empty, blocks waiting for the next I/O event, unless there are timers about to expire or
setImmediatecallbacks pending, in which case it returns immediately so we can process them.
That second behaviour is the closest thing to magic in the whole loop. A healthy Node server spends most of its wall-clock time parked in epoll_wait (or kqueue on macOS, IOCP on Windows). Zero CPU. Waiting. Then the kernel pokes it ("here's the bytes from socket 47") and it runs the callback. That's why one Node process can handle tens of thousands of idle WebSocket connections: 10,000 idle connections cost roughly nothing.
It also explains why CPU work is so deadly in this model. If you start a 200ms JSON.parse inside a poll-phase callback, the loop cannot poll during those 200ms. Every other connected client is frozen. Not slow. Frozen. We'll come back to this.
Check: setImmediate's home
After poll, we enter check. The only thing here is callbacks scheduled by setImmediate(fn). This phase exists specifically to let you say "run this after the I/O callbacks in the current loop turn, but before any timers fire." That's a genuinely useful semantic, and more on it in a second.
Close callbacks
If a handle gets closed abruptly (socket.destroy(), a server shutting down), its 'close' event fires here. Then we loop back to timers.
The microtask queues: the other half of the picture
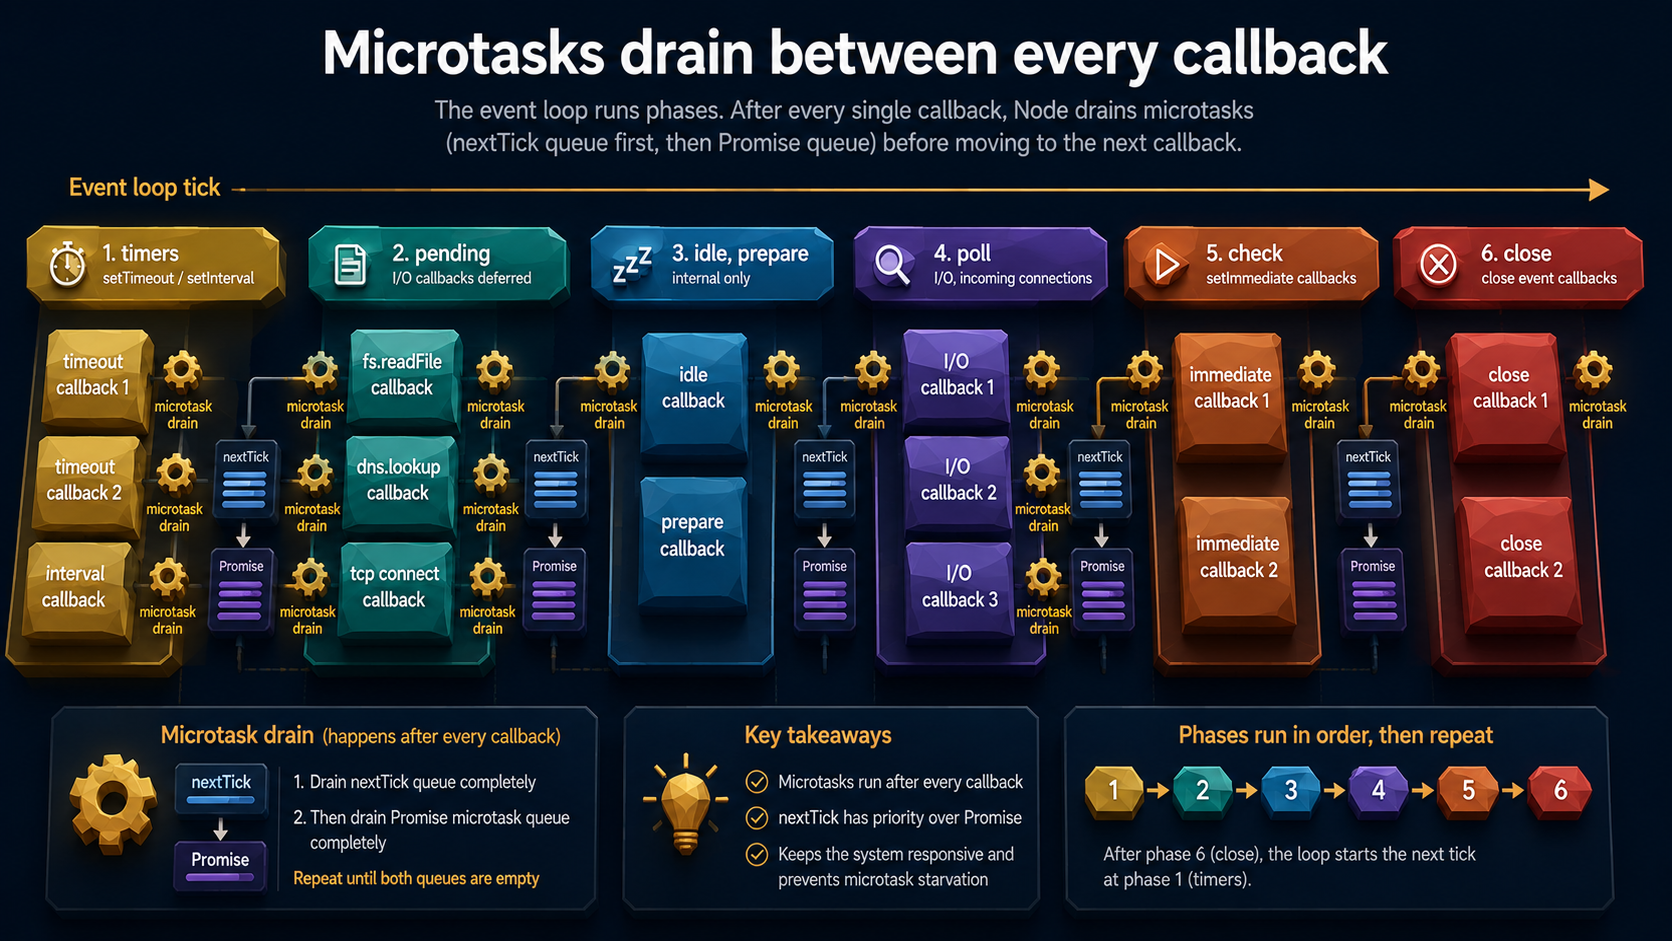
Phases run callbacks. Microtasks run between callbacks. This is the part that the "single queue" mental model totally misses.
There are two microtask queues:
- The
process.nextTickqueue: Node-specific, drained first. - The Promise microtask queue: the same one the browser uses, drained second.
After every single callback completes (not after each phase, after each callback within a phase) both queues are fully drained before the next callback runs. That includes between a setTimeout firing and the next setTimeout in the same timers phase. It includes between await resuming and the next thing happening.
The priority order, ranked from "runs first" to "runs last":
process.nextTick(fn)callbacks- Microtasks:
Promise.then,queueMicrotask(fn), the body of anasyncfunction after anawait - The next thing the current event loop phase was going to do (another callback in the queue, or the next phase)
This is the real answer to "what does await actually do?" It splits the function into two halves at the await point, schedules the second half as a Promise microtask, and yields. When the awaited promise resolves, the microtask runs, typically before the next macrotask, even if a setImmediate is queued and ready.
Here's the canonical demonstration. Predict the output before reading on:
setImmediate(() => console.log('1: setImmediate'));
setTimeout(() => console.log('2: setTimeout 0'), 0);

Promise.resolve().then(() => console.log('3: promise'));
process.nextTick(() => console.log('4: nextTick'));

console.log('5: sync');
The output:
5: sync
4: nextTick
3: promise
2: setTimeout 0    (or 1, depending on system load - see below)
1: setImmediate    (or 2)
The sync console.log runs first because it's, well, synchronous. Then the current operation ends and microtasks drain: nextTick first, Promise second. Then the loop continues to the next phase and the macrotasks fire, and the order of setTimeout(fn, 0) versus setImmediate is genuinely undefined here. Node clamps the timer to a 1ms minimum, and whether 1ms has elapsed by the time the loop reaches timers depends on how fast your machine was during process startup. Inside an I/O callback the order is deterministic (setImmediate always wins), but at the top level it's a race.
That race is the most popular Node.js interview gotcha. It is also a thing you should never depend on in production code. If you need ordering, use setImmediate.
nextTick is not a microtask, except when it is
process.nextTick predates Promises in Node by years. The name is misleading: it doesn't run "next tick" of the event loop. It runs immediately after the current operation completes, before any other I/O or timer. It is, effectively, a microtask with even higher priority than Promise microtasks.
The danger: an infinite chain of process.nextTick(fn) calls where fn schedules another nextTick will starve the event loop forever. The poll phase never runs. I/O never completes. Your server stops responding while burning a full CPU core. The same is technically true of Promise microtask chains, but nextTick is faster, more tempting, and easier to abuse. The Node docs explicitly warn against using it for "deferring work"; use setImmediate for that.
setImmediate vs setTimeout vs nextTick: when to reach for which
After all of the above, the practical rules are:
setImmediate(fn): "runfnon the next loop turn, after the current I/O callbacks." Use this when you want to break up CPU work without blocking I/O, or when you want a deterministic "after this callback finishes" hook.setTimeout(fn, 0): almost never the right choice in Node. Use it when you genuinely want to wait a minimum time. For "run later" semantics, prefersetImmediate.process.nextTick(fn): when you need to defer a callback so that it runs before any I/O, typically to flush state changes (emit an event after the constructor returns but before any I/O can observe a half-built object). Treat it as a sharp tool. Don't use it as a "later" mechanism.queueMicrotask(fn): when you need microtask semantics but not the nextTick-jumps-the-line behaviour. Cleaner thanPromise.resolve().then(fn)and exists for exactly that reason.
The interview-favourite distinction "setImmediate vs setTimeout(fn, 0)" has a clean answer inside an I/O callback: setImmediate is guaranteed to run before any timers in the same loop turn. Outside an I/O callback (top-level script, after a microtask), the order is undefined because it depends on the 1ms timer clamp. Now you can stop guessing and just remember which case you're in.
Where the performance bugs hide
Once you can name the phases, the classic Node performance bugs become recognisable. They're all variants of three failures.
1. CPU work in a poll-phase callback
The killer. JavaScript runs on one thread. While that thread is executing JSON.parse on a 50MB payload or running a regex with catastrophic backtracking or hashing a password with bcrypt.compareSync, the event loop cannot enter the poll phase, which means it cannot accept new connections, cannot deliver bytes to existing ones, cannot fire timers. Everything pauses.
You can see this in production as latency spikes that correlate with payload size. The fix is one of:
- Stream the work (
stream.Readable,JSONStream,pipeline) instead of buffering. - Move it to a worker thread (
worker_threads). - Move it to a libuv worker via a native binding (most crypto and zlib operations).
- Yield mid-loop with
await new Promise(r => setImmediate(r))to let the loop breathe.
That last pattern is worth knowing. Inside a long synchronous loop, sprinkling a setImmediate yield every N iterations turns "freezes the server for 800ms" into "takes 850ms but stays responsive."
async function processBatch(items) {
  for (let i = 0; i < items.length; i++) {
    doExpensiveWork(items[i]);
    if (i % 1000 === 0) {
      // Hand control back to the event loop so I/O can drain.
      await new Promise(resolve => setImmediate(resolve));
    }
  }
}
2. Microtask starvation
A Promise chain that schedules another microtask on every resolution will run forever without the event loop progressing. The textbook version is silly:
function spin() {
  return Promise.resolve().then(spin);
}
spin();
The realistic version is sneakier. An async recursive walk where every recursion is await something() and something() resolves synchronously (cached value, in-memory data) creates a microtask chain with no I/O suspension. Symptom: 100% CPU on one core, no I/O happening, every endpoint times out. The diagnostic move is node --inspect plus the profiler, where you'll see one stack frame eating everything.
The fix is to insert a real macrotask yield (setImmediate) on a periodic basis, or restructure so the recursive step happens via setImmediate instead of via await.
3. The thread pool bottleneck
Default UV_THREADPOOL_SIZE is 4. Four. On your 32-core production box. By default.
This is fine if your app is mostly network I/O: sockets don't use the pool. It is catastrophic if your app does many concurrent fs.readFile calls, or crypto.pbkdf2, or dns.lookup (the legacy variant), or zlib.gzip. Past four concurrent operations, the fifth one waits, even though your CPU is idle. The symptom looks like artificial throughput ceilings that don't correlate with CPU usage.
Two things to know:
- You set it before the first call into libuv.
process.env.UV_THREADPOOL_SIZE = 64insideindex.jsdoes not work. By the time your JS runs, libuv has already initialised the pool. Set it as a real environment variable in the shell, or in yourpackage.jsonscript, or in your container's env. A common bug. - There's an upcoming change in libuv that auto-sizes the pool based on
uv_available_parallelism(), but it isn't on by default in the stable Node lines yet. Don't assume it's solved for you.
For DNS specifically, prefer dns.resolve* (which uses libuv's async networking, not the pool) over dns.lookup (which uses getaddrinfo on a pool thread) on high-throughput servers.
A worked example: why your endpoint is slow at exactly 4 concurrent requests
Picture a Node service that reads a small file, gzips it, hashes the result with crypto.pbkdf2, and returns the hash. With one client hitting it, response time is 40ms. With four concurrent clients, response time is still ~40ms. With five, it jumps to ~80ms. With ten, it's ~120ms. With sixteen, it's ~160ms.
That staircase pattern is the thread pool. Each request needs a libuv worker (for pbkdf2, which is CPU-bound but lives in C++ on the pool). You have four workers. The fifth, sixth, seventh, and eighth requests all queue behind the first four, then run as a group when those finish. Ninth through twelfth queue behind those. The endpoint's throughput is exactly bounded by UV_THREADPOOL_SIZE.
The fix isn't "make pbkdf2 faster." It's UV_THREADPOOL_SIZE=number-of-cores, and now your CPU actually gets used. Or, on a much bigger box, UV_THREADPOOL_SIZE=2*cores, since the work is interruptible. Numbers above ~128 stop helping and start hurting because of thread contention.
If you've never seen this latency staircase in a load test, run one. It is the most legible "the event loop is real" demonstration there is.
How to actually observe the event loop
Three tools, in order of how often you'll reach for them:
perf_hooks.monitorEventLoopDelay: built into Node, samples the lag between when a timer was supposed to fire and when it actually did. The number you want for SLOs.
const { monitorEventLoopDelay } = require('node:perf_hooks');

const h = monitorEventLoopDelay({ resolution: 20 });
h.enable();

setInterval(() => {
  console.log({
    p50: h.percentile(50) / 1e6,    // ms
    p99: h.percentile(99) / 1e6,
    max: h.max / 1e6,
  });
  h.reset();
}, 5000);
p99 above ~50ms on an idle server means something is blocking the loop on a regular interval, and you have a problem worth chasing. Pipe this metric to your monitoring stack; it is the single most useful Node-specific gauge there is.
--prof and the CPU profiler: when the loop is lagging, run the inspector and capture a CPU profile. The frame eating the budget will be unmistakable.
clinic.js (especially clinic doctor): combines event-loop delay, CPU, memory, and active handles into one HTML report. Worth installing the first time you have a perf incident; you'll wish you'd had it sooner.
The mental model worth keeping
Forget "Node has an event loop." That sentence is too vague to be useful. Keep this instead:
Node has six phases. Between every callback in every phase, the nextTick queue drains, then the Promise microtask queue drains. CPU work in any callback blocks every other callback. The thread pool is four workers wide by default and bottlenecks anything that uses it.
Internalise that and the surprising behaviours stop being surprising. The "why did my Promise resolve before my setImmediate" question answers itself. The "why does throughput plateau at exactly 4x single-request latency" question stops being mysterious. The "why is my timer firing late" question becomes diagnosable in one line of code.
Most of what makes Node a good fit for I/O-heavy services lives in that one paragraph. And most of what makes Node painful when it's the wrong fit lives there too. Knowing the difference is what makes you good at it.