
Here's a five-line function that leaks memory every time you call it:
function setupHealthcheck() {
  const config = loadConfig(); // returns a 40 MB JSON blob
  setInterval(() => {
    fetch(config.healthUrl).then((r) => log(r.status));
  }, 1000);
}
It compiles. It passes its tests. It even runs cleanly for a day. Call it three times in your bootstrap by accident: a refactor, a test that re-imports the module, a hot-reload during local dev. And your process is suddenly holding 120 MB of config it can never let go of, because setInterval returns a handle that lives forever unless you clear it, the callback closes over config, and V8 cannot prove that anyone has stopped caring.
That's almost every "memory leak" in Node, dressed in different clothes. The garbage collector is not broken. You did not forget to call free(). The object is still reachable from somewhere: a timer, a listener, a module-level Map, a closure. And reachable means alive. The whole game is understanding what counts as reachable and what doesn't.
What A Leak Actually Is In V8
To talk about Node memory leaks at all, you need a working mental model of V8's garbage collector. Not the whole paper, just enough that the failure modes stop looking like magic.
V8 splits the heap into two main regions: the new space and the old space. Most allocations land in the new space, which is small (single-digit megabytes), and gets cleaned up by a very fast algorithm called Scavenge that runs constantly. The Scavenge copies anything still alive into a survivor region and throws everything else away. The "generational hypothesis" V8 leans on is that most objects die young; for short-lived JSON parses, request handlers, and intermediate arrays, that's exactly right, and Scavenge is cheap enough to run hundreds of times a second without you noticing.
Anything that survives a couple of Scavenges gets promoted to the old space, which is the bigger region. For years the default cap was around 1.5 GB on 64-bit systems regardless of how much RAM the machine actually had. The old space is cleaned by a heavier algorithm called Mark-Sweep-Compact. V8 traces every reference from a set of roots (the global object, the active stack, the C++ handles wrapping things like timers and sockets) and marks everything reachable as alive. Anything it didn't mark gets swept and the survivors get compacted to defragment the heap. Modern V8 (the Orinoco project) does most of this on background threads, so the user-visible pause is short, but the algorithm is still the same in spirit.
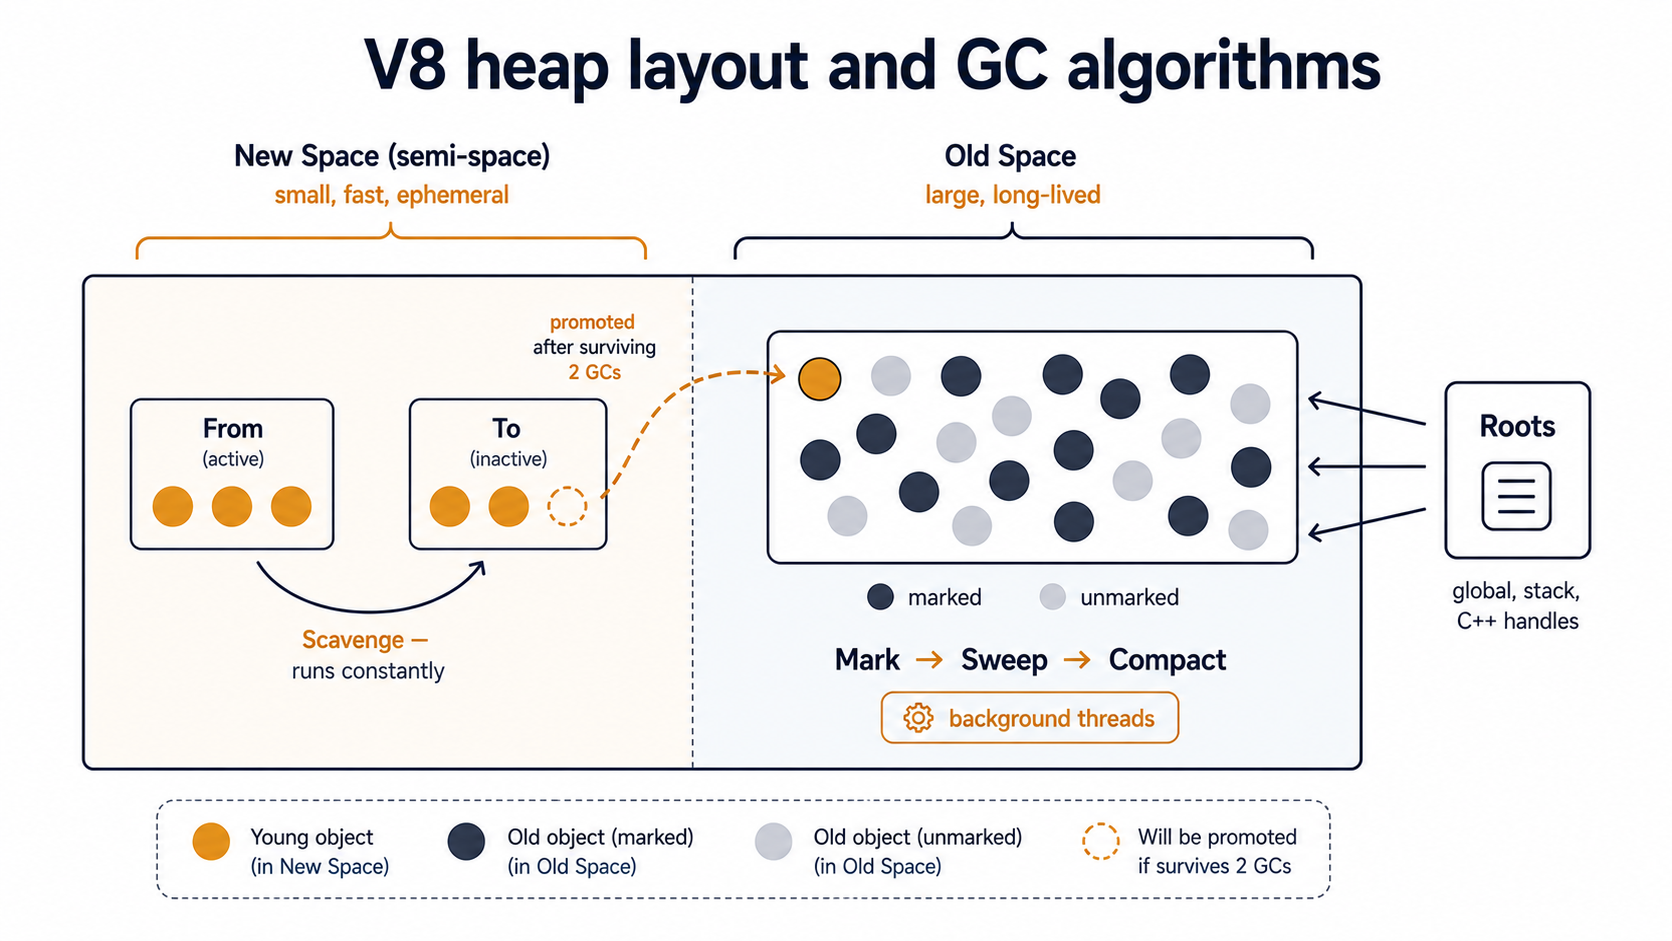
That's the engine. The leak definition falls out of it: an object leaks when it stays reachable from a root, through some chain of references, even though your program has no real intention of using it again. The GC is doing exactly what it's told. The problem is that something (a timer queue, an event emitter, a module-level cache) is still telling it the object matters.
Once you internalise that, debugging shifts from "who forgot to free this?" to "what is still holding a reference to this?". Those are very different questions, and the second one has tools.
Listeners You Forgot To Remove
The single most common "Node has a memory leak" Slack message in any team I've seen starts with this warning:
(node:11423) MaxListenersExceededWarning: Possible EventEmitter memory leak detected. 11 close listeners added to [Socket]. Use emitter.setMaxListeners() to increase limitThat warning exists for one reason: Node ships a built-in heuristic that fires when any single event on any single EventEmitter accumulates more than 10 listeners. The default is set in events.defaultMaxListeners and is exactly 10 because the Node maintainers picked a number that's small enough to catch real leaks early and large enough that normal code never trips it. It's not a hard limit. Node prints the warning and keeps going. But if you see it in production logs, you almost certainly have a leak. Don't reach for setMaxListeners(100) to silence it. That's the equivalent of taping a piece of cardboard over the check-engine light.
The shape of the bug is always the same:
import { createReadStream } from 'node:fs';

export function uploadFile(path: string, sock: Socket) {
  const stream = createReadStream(path);

  sock.on('close', () => {
    stream.destroy();
  });

  stream.pipe(sock);
}
That looks defensive. If the socket closes mid-upload, the stream should be torn down. The problem is that uploadFile is called once per upload, and every call adds another close listener to the same long-lived socket. The first 10 uploads work fine. The 11th triggers the warning. By the 1000th, the socket is carrying a thousand closures, each one keeping its own stream alive long after the upload is done.
The fix is to scope the listener to the work it's protecting: either once, or an explicit off when the stream finishes:
export function uploadFile(path: string, sock: Socket) {
  const stream = createReadStream(path);
  const cleanup = () => stream.destroy();

  sock.once('close', cleanup);
  stream.once('end', () => sock.off('close', cleanup));

  stream.pipe(sock);
}
There's a more subtle variant. AbortController is now the recommended way to wire teardown across async boundaries, and every abortController.signal.addEventListener('abort', ...) you add without removing later does the same thing as a forgotten EventEmitter listener, except now it's on a signal you probably handed to a fetch or a database driver, so the chain of retained closures is one indirection deeper.
When the MaxListenersExceededWarning fires, the warning includes the event name and the emitter type. Take that seriously: it's the only free leak detector Node hands you, and it's almost always pointing at a real bug.
Timers That Outlive Their Reason To Exist
setTimeout and setInterval are the second classic leak source, and they're tricky because the leak isn't really about the timer itself. It's about everything the timer's callback closes over.
When you call setInterval(cb, 1000), you get back a Timeout object that's tied into the libuv event loop. That object holds a reference to your callback. Your callback holds a reference to its enclosing scope. The enclosing scope holds references to every variable the callback references, transitively. Until you call clearInterval, none of that can be garbage collected, because the timer is reachable from a root inside libuv itself.
In the opener, every call to setupHealthcheck schedules a new interval that captures a new config. The intervals never die. The configs never die. Memory climbs forever.
The fix is the obvious one: hold onto the handle, and clear it when the work it represents is done.
export function setupHealthcheck(): () => void {
  const config = loadConfig();
  const handle = setInterval(() => {
    fetch(config.healthUrl).then((r) => log(r.status));
  }, 1000);

  return () => clearInterval(handle);
}
Now the caller is responsible for tearing the work down, usually in the same place where the corresponding setup happens, like a server shutdown hook or a test afterEach.
There's a small Node-specific lever here too. The handle returned by setInterval and setTimeout has an unref() method, which tells the event loop "don't keep the process alive just because of me". That's the right call for background pings, log flushers, and metric reporters: you want them to run while the process is running, but not to be the reason the process refuses to exit. It doesn't help with leaks (the timer still holds its callback alive while the process runs), but it stops a sibling bug: zombie processes that won't exit cleanly because of a forgotten timer.
The most insidious timer leak isn't in your application code at all. It's setTimeout with a long delay inside a library that re-creates a new client every time you instantiate it. Database clients, retry wrappers, distributed-tracing initialisers, anything that internally schedules background work and expects you to call its close() method on shutdown. If you new DatabaseClient(...) on every request and never call close, every one of those clients sits in memory holding its own retry timers and connection pools. The leak shows up in the heap snapshot as thousands of identical client instances. The fix is to instantiate once and reuse, or, if you really need short-lived clients, call close in a finally.
Closures That Capture More Than They Should
Closures themselves don't leak. A closure that nothing references gets collected like any other object. What leaks is the chain: something long-lived holds the closure, and the closure holds, through its captured scope, something much bigger than you intended.
Here's a version of the bug that's easy to miss in review:
export function makeMemoiser<T>(loader: () => Promise<T>) {
  let cached: T | undefined;

  return async function get(): Promise<T> {
    if (cached === undefined) {
      cached = await loader();
    }
    return cached;
  };
}

// elsewhere
const getUsers = makeMemoiser(async () => {
  const conn = await openDb();
  const rows = await conn.query('SELECT * FROM users');
  await conn.close();
  return rows;
});
Looks fine. But getUsers is a closure over the anonymous loader, which is a closure over openDb and the connection it returned. V8 has gotten smart about pruning unused captures. For years it would keep an entire scope alive even if the inner function only used one variable. But you should not bet your production memory on the optimiser. If the loader references any large object (a config, a buffer, an audit log handle) in its outer scope, that object stays alive as long as getUsers is reachable. And getUsers, being a module-level export, is reachable for the lifetime of the process.
The fix is to be explicit about what you want to keep: pull the large thing out, only close over the small thing.
async function loadUsers() {
  const conn = await openDb();
  try {
    return await conn.query('SELECT * FROM users');
  } finally {
    await conn.close();
  }
}

export const getUsers = makeMemoiser(loadUsers);
Now getUsers closes over a tiny module-level function reference instead of an inline arrow that captured an outer scope.
The general shape of the closure-leak fix is the same every time: shrink the closure's captured environment to the smallest set of names it actually needs. Pull big objects out of the enclosing scope, pass them in explicitly, and let them go out of scope normally.
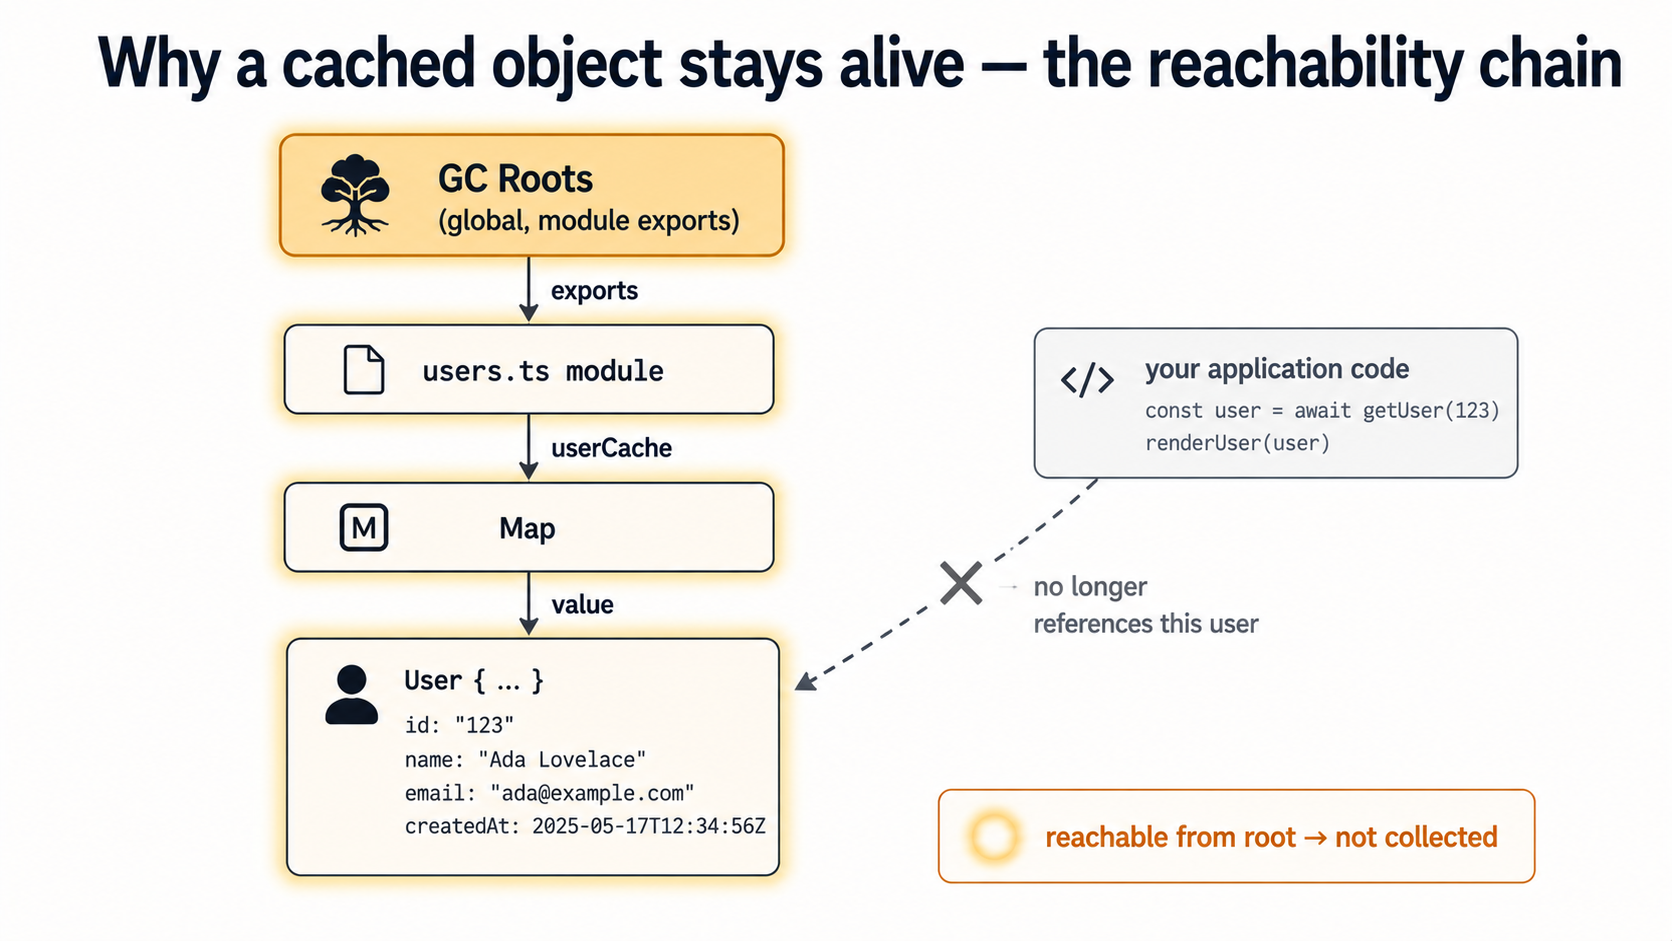
Caches Without Eviction Are Just Slow Memory Leaks
A cache without an eviction policy is not a cache. It's a Map that grows until your process dies. This is one of the most common production memory leaks because it doesn't feel like a leak. Every entry was put there on purpose, every entry could in theory be useful again, and the code is doing what you wrote. It just happens that "what you wrote" was "remember everything forever".
const userCache = new Map<string, User>();

export async function getUser(id: string) {
  if (!userCache.has(id)) {
    userCache.set(id, await fetchUser(id));
  }
  return userCache.get(id)!;
}
In a long-running service with a high-cardinality key space (user IDs, request IDs, URLs), this Map will grow to the size of your active key set, which usually equals all keys you've ever seen. After a week of production traffic, it's enormous.
There are three serious answers, in order of how often you should reach for them.
1. A bounded cache with an eviction policy. Libraries like lru-cache give you a max size, a ttl, or both. Pick the bound that fits the access pattern: LRU for hotspot data, TTL for things that go stale, both for the cautious default.
import { LRUCache } from 'lru-cache';

const userCache = new LRUCache<string, User>({
  max: 10_000,
  ttl: 5 * 60 * 1000, // 5 minutes
});

export async function getUser(id: string) {
  const hit = userCache.get(id);
  if (hit) return hit;

  const user = await fetchUser(id);
  userCache.set(id, user);
  return user;
}
This is the answer for nearly every cache in nearly every service. Boring, well-trodden, easy to reason about.
2. A WeakMap keyed by something the caller already holds. Useful when the natural key is an object you also own. For example, attaching parsed metadata to a request object, or caching computed values per-user-session-object. The WeakMap does not stop the key from being garbage collected, so when the request finishes and the session ends, the cache entry vanishes with it. The catch is that WeakMap only takes objects as keys. You cannot use it for string IDs from the outside world.
const parsed = new WeakMap<Request, Body>();

export function getBody(req: Request): Body {
  let body = parsed.get(req);
  if (!body) {
    body = parse(req);
    parsed.set(req, body);
  }
  return body;
}
When the request finishes and nothing holds the Request object anymore, its Body becomes unreachable too. Clean, no eviction policy needed.
3. WeakRef and FinalizationRegistry. TC39 added these for caches where you genuinely want the entries to live only as long as something else holds a strong reference to them. They're powerful, but the TC39 proposal itself warns that weak references and finalizers are an advanced feature that requires careful thought, and that if a simpler pattern works, you should use the simpler pattern.
In practice, an LRU with a TTL solves the same problem in nine out of ten cases with far less surprise. Reach for WeakRef when you're building something like an in-memory object pool where the lifecycle is genuinely tied to other strong references, not as a default tool.
The general rule for caches in Node services: if you can write down the upper bound, write it down; if you can write down the expiry, write it down; if you can do both, do both. The opposite is an unbounded Map that you trust to "just work". One of the most reliable ways to set fire to a Node process at 3 AM.
Global State Is A Leak Looking For An Excuse
Module-level state in Node is sticky. When you import a module, Node caches it in require.cache and reuses the same instance for the lifetime of the process. Anything you stash at module scope (a Map, a Set, an array, an EventEmitter) lives until the process dies. That is sometimes exactly what you want, but it's also a quiet enabler for every other leak on this page.
Look at this trio:
const subscribers = new Set<(event: Event) => void>();

export function subscribe(fn: (event: Event) => void) {
  subscribers.add(fn);
}

export function publish(event: Event) {
  for (const fn of subscribers) fn(event);
}
Every caller can subscribe. Nobody can unsubscribe, because no one exposed it. The subscribers Set lives at module scope, and module scope lives forever. Every callback is a closure over its caller's surroundings. Multiply by every test that imports this module, every HTTP handler that registers itself, every hot-reload during local dev that re-imports the calling module without re-importing the registry, and the leak is structural. It's baked into the API.
Two fixes worth knowing.
First, always pair subscribe with unsubscribe (or return a teardown function from subscribe itself):
export function subscribe(fn: (event: Event) => void): () => void {
  subscribers.add(fn);
  return () => subscribers.delete(fn);
}
Now the lifecycle is in the caller's hands, and there's no API path that lets them register without being able to clean up.
Second, be ruthless about what you let live at module scope. A function declaration is fine: it's tiny and stateless. A const that's a small config object is fine. A Map or Set or Array that grows during execution is a yellow flag. An EventEmitter is a red flag. If you must have one, document its lifecycle: how does it shrink? Under what conditions is an entry removed? If you can't answer that, you've built a leak with a fancier name.
Hot-reloaded development is where module-level state hurts most. Tools like tsx --watch and Next.js's dev server re-execute your modules on file change. If a module schedules a setInterval at top level, you can end up with dozens of intervals running in parallel after an afternoon of editing, each one a generation older than the last. The fix in dev is the same as in prod: own the teardown.
How To Actually Find One
You'll know you have a leak when RSS climbs steadily over hours under steady load, when the process eventually OOMs and restarts, or when GC pauses get long and frequent because the old space is constantly full. By the time you notice, the leak is usually deep in the heap and the only honest way out is a heap snapshot.
Here's the loop, in the order that actually works.
1. Confirm it's a leak, not just a warm cache. Plot resident set size or process.memoryUsage().heapUsed over time under steady load. A real leak grows monotonically and never plateaus. A warm cache climbs to a ceiling and stops. If you can't separate those two by eye, you're not ready for the snapshot step yet. Get a longer window of data first.
2. Capture a heap snapshot at two points. From Node 12 onward, you can call v8.writeHeapSnapshot() from inside the process at any time, no external tooling required:
import { writeHeapSnapshot } from 'node:v8';

export function dumpHeap() {
  const file = writeHeapSnapshot();
  console.log(`heap snapshot written to ${file}`);
}
Wire this to a route, a signal handler, or a flag: anything that lets you trigger it without restarting the process. Take one snapshot when memory is still reasonable. Take another after the leak has had time to grow. The trick is patience. Five minutes apart usually isn't enough; an hour apart is usually plenty.
3. Compare snapshots in Chrome DevTools. Open chrome://inspect, then "Open dedicated DevTools for Node", then drag both .heapsnapshot files into the Memory tab. Select the newer snapshot, switch to Comparison mode against the older one, and sort by Size Delta descending. The constructors at the top, the ones that grew the most between the two snapshots, are your leak candidates.
The single most useful column once you've found a candidate is Retained Size. Shallow size tells you how big a single object is. Retained size tells you how much memory would become collectable if that object went away. A Map with shallow size 200 bytes can have retained size 800 MB if it's the root of the chain that's keeping a million users alive.
Click into the constructor, pick a representative instance, and look at the Retainers panel at the bottom. That's the chain back to a GC root: the literal path of references that's keeping this object alive. Read it bottom-up. The first thing you don't expect to see is your leak.
4. Reach for clinic.js if the leak is shape-dependent. clinic doctor and clinic heapprofile are great for "I don't even know which subsystem is leaking" cases: they produce flamegraphs and time-correlated charts you can scan visually. They are not great for very long-running production traces; the report-generation step can time out for runs longer than an hour. For dev-environment reproductions and short load tests, they're excellent.
5. Treat --max-old-space-size as a diagnostic ceiling, not a fix. When a process is OOM-killed because it hit the V8 heap limit, raising the limit just delays the OOM. The leak still exists. Use the flag during debugging to give yourself enough headroom to capture useful snapshots before the process dies, then take the flag out and fix the actual cause.
A handful of operational lessons that go alongside the loop. Take snapshots during low-traffic hours because the snapshot itself temporarily pauses the event loop and spikes CPU; on a hot process this can cause request timeouts. Save snapshots somewhere persistent: they can be 200 to 500 MB for a process with a 1 GB heap, and you don't want to lose them when the container restarts. And keep the older snapshots; the most useful comparison is often not the first leak you spotted, but the change between two later snapshots, after the leak has had time to grow into something the GC pressure makes obvious.
The Pattern Underneath All Of Them
Read the six categories back and the same shape shows up in every one. A long-lived thing (a socket, the libuv timer queue, a module-level Set, an exported memoiser) holds a reference to something. That reference is a closure, or a callback, or an entry in a Map. The closure or callback or entry transitively holds something bigger than you intended. The GC is doing exactly the right thing: nothing is unreachable, so nothing is collected. Memory climbs.
The leak isn't a bug in the GC. It isn't a bug in Node. It's a place where the lifetime of a reference quietly exceeded the lifetime of your intent to use it.
The good news is that this reframes the question into something you can actually answer. Instead of "why is my process leaking?", ask: "what long-lived thing is holding a reference to this object, and is there a reason it still should?" If there's no good reason, you've found your leak, and the fix is usually one of three moves: remove the listener, clear the timer, or bound the cache. Boring fixes, every time. Which is what you want at 3 AM.