So you've wired up Prometheus, opened the Node.js exporter, and your dashboard now has forty-seven panels. CPU per core, RSS, heap used, heap total, external memory, ArrayBuffers, GC pause time by generation, libuv handles, file descriptors, TLS handshakes, connection counts, two flavours of histogram for latency, and somewhere down the bottom a small chart for the actual thing your users care about.
You stare at it during an incident. None of it tells you what's broken.
That's the failure mode of "default metrics", they give you everything, which is the same as nothing. The five numbers below are the ones that actually move when something is wrong. Get them right and you can throw the rest into a "deep dive" tab and ignore them until the on-call engineer needs to drill in.
Event Loop Lag, The One Number Worth A Pager
Node runs your JavaScript on a single thread. Every request, every callback, every Promise continuation queues up behind whatever the event loop is doing right now. If a single handler blocks the loop for 200ms, every other in-flight request waits 200ms. That's not latency, that's tail latency, the kind that wrecks p99 charts and makes your service look mysteriously slow under load.
Event loop lag is the metric that catches this directly. It measures how long a timer scheduled for "now + 0ms" actually takes to fire. In a healthy process, it's microseconds. In a sick process, it's tens or hundreds of milliseconds.
The built-in way uses perf_hooks:
import { monitorEventLoopDelay } from 'node:perf_hooks';

const histogram = monitorEventLoopDelay({ resolution: 20 });
histogram.enable();

setInterval(() => {
  // values are in nanoseconds
  const p50_ms = histogram.percentile(50) / 1e6;
  const p99_ms = histogram.percentile(99) / 1e6;
  console.log({ event_loop_lag_p50_ms: p50_ms, event_loop_lag_p99_ms: p99_ms });
  histogram.reset();
}, 5_000);
If you're using prom-client, collectDefaultMetrics() already exposes nodejs_eventloop_lag_seconds and the percentile flavours (p50, p90, p99). Wire those into Prometheus and you're done.
What to expect:
- p99 under 10ms, healthy. The event loop is keeping up.
- p99 between 10ms and 50ms, under load, fine. Steady-state, suspicious.
- p99 over 100ms, something is blocking the loop. Find it before users do.
The alert that earns its keep:
- alert: NodeEventLoopLagHigh
  expr: nodejs_eventloop_lag_p99_seconds > 0.1
  for: 2m
  labels: { severity: page }
  annotations:
    summary: "Event loop p99 lag above 100ms for {{ $labels.instance }}"
    runbook: "Check for sync work: JSON.parse on big bodies, bcrypt.hashSync, regex on huge strings, sync fs."
One alert. One number. If it fires, you know exactly what kind of problem you have, CPU work blocking the loop, and the runbook list is short. That's worth more than thirty panels of "things you can look at."
Memory: Heap, RSS, And Why GC Pauses Matter
Memory is the metric most teams measure wrong. They graph one number, usually RSS, and then panic when it climbs, even though Node's runtime is doing exactly what it's supposed to: holding on to memory because allocating it back from the OS is expensive.
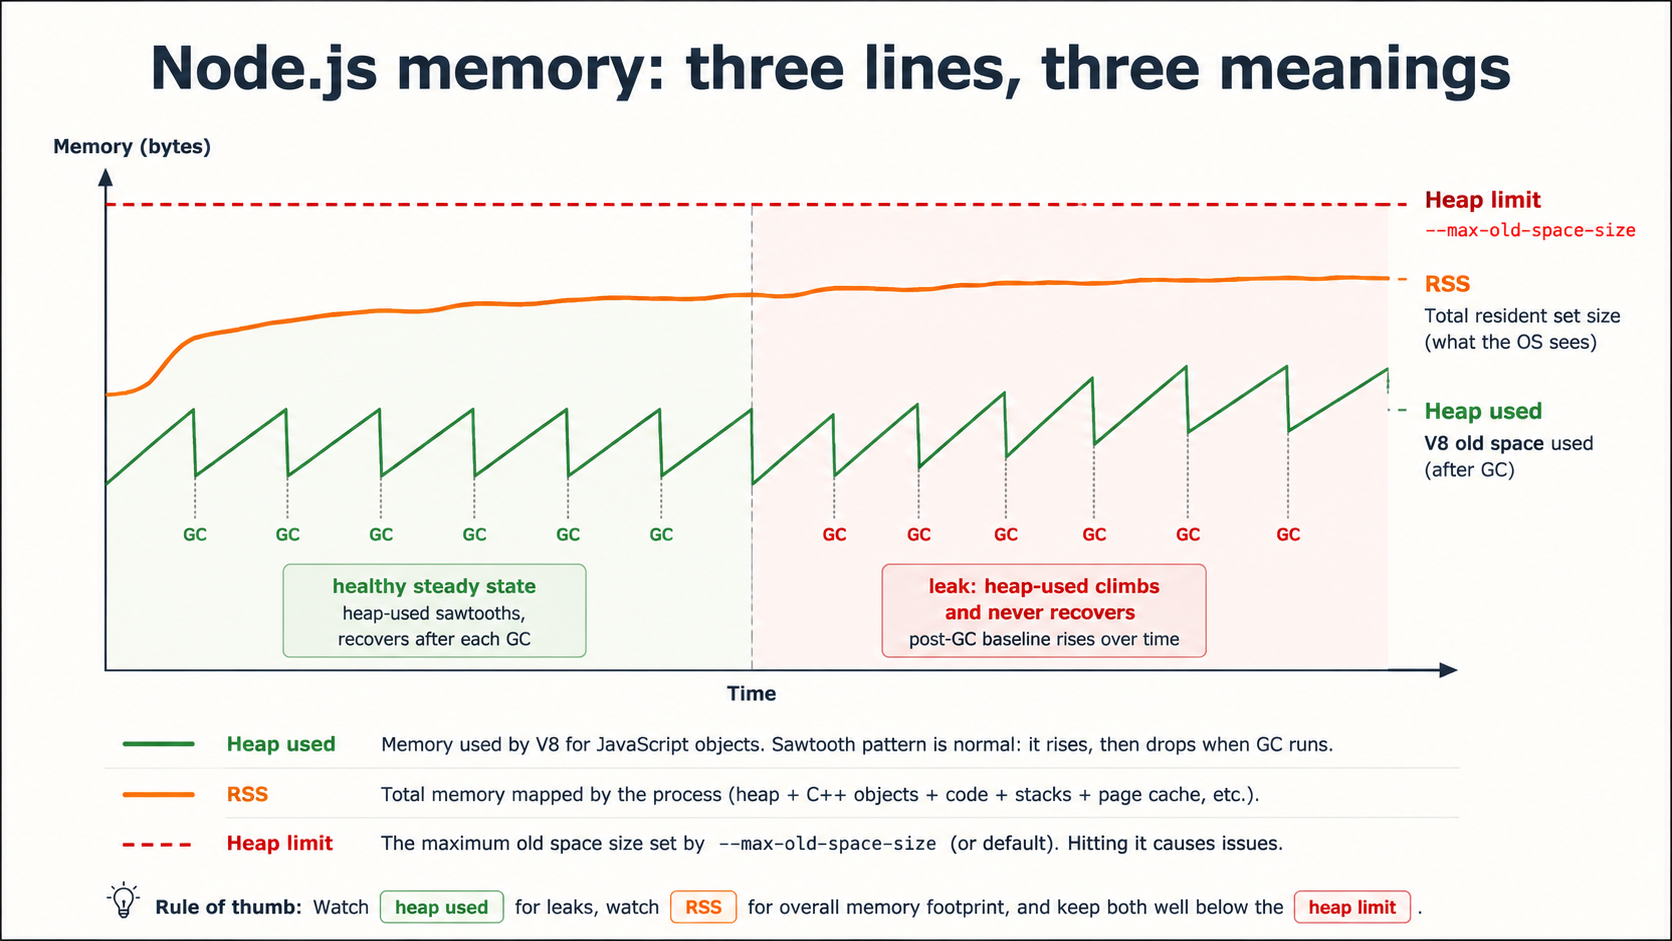
There are three numbers that actually matter, and they tell you different things.
Heap used (process.memoryUsage().heapUsed) is the size of live JavaScript objects after the most recent GC. This is what a leak looks like: a slow, monotonic climb that never recovers after a major collection. If your heap-used line on a one-week chart is going up and to the right, you have a leak. If it's a sawtooth, climbing, then dropping at GC, you don't.
RSS (process.memoryUsage().rss) is the total physical memory the process holds, including the V8 heap, the C++ runtime, native modules, buffers, and code pages. RSS will always be larger than heap-used, and RSS climbing without heap-used climbing usually means native allocations, large Buffers, a leaky native addon, or just the runtime growing into available memory.
GC pause time is the one nobody graphs. Every major garbage collection pauses the event loop. If your major GCs are taking 200ms, your p99 latency is at minimum 200ms whenever they fire. The prom-client default metrics expose this as nodejs_gc_duration_seconds with a kind label (major, minor, incremental). Watch the major bucket.
import v8 from 'node:v8';

setInterval(() => {
  const mem = process.memoryUsage();
  const heap = v8.getHeapStatistics();

  console.log({
    rss_mb: (mem.rss / 1024 / 1024).toFixed(1),
    heap_used_mb: (mem.heapUsed / 1024 / 1024).toFixed(1),
    heap_total_mb: (mem.heapTotal / 1024 / 1024).toFixed(1),
    heap_limit_mb: (heap.heap_size_limit / 1024 / 1024).toFixed(1),
    external_mb: (mem.external / 1024 / 1024).toFixed(1),
  });
}, 10_000);
The alert worth setting isn't on RSS or heap-used in absolute terms, those depend on your container limits. It's on the gap between heap-used and the heap size limit:
- alert: NodeHeapNearLimit
  expr: (nodejs_heap_size_used_bytes / nodejs_heap_size_limit_bytes) > 0.9
  for: 5m
When that fires, you're one allocation away from JavaScript heap out of memory and a process restart. Either raise --max-old-space-size, find the leak, or scale horizontally.
Queue Depth, The Saturation Signal Nobody Builds Dashboards For
Throughput tells you how much work is finishing. Queue depth tells you how much work is waiting. Those are different metrics, and the second one is more important.
There are at least three "queues" in a typical Node.js service, and each one has a different saturation signal:
1. The HTTP request queue. Requests in flight that the server has accepted but hasn't responded to yet. Easy to track with a middleware:
import { Gauge } from 'prom-client';

const inFlight = new Gauge({
  name: 'http_requests_in_flight',
  help: 'Currently processing HTTP requests',
  labelNames: ['route'],
});

export function inFlightMiddleware(req, res, next) {
  const route = req.route?.path ?? 'unmatched';
  inFlight.inc({ route });
  res.on('finish', () => inFlight.dec({ route }));
  res.on('close', () => inFlight.dec({ route }));
  next();
}
If http_requests_in_flight is climbing while throughput is flat, you've hit a saturation point, handlers are slowing down, requests are piling up, and the next thing to break is the load balancer's connection pool.
2. Background job queues. If you're running BullMQ, BeeQueue, Agenda, or anything Redis-backed, the queue's getWaitingCount() and getActiveCount() are your saturation signals. A queue that grows faster than it drains will eventually overflow Redis memory or hit your retention limit.
import { Queue } from 'bullmq';
import { Gauge } from 'prom-client';

const queue = new Queue('emails', { connection: redis });

const waiting = new Gauge({ name: 'queue_waiting_count', help: 'Jobs waiting', labelNames: ['queue'] });
const active = new Gauge({ name: 'queue_active_count', help: 'Jobs in flight', labelNames: ['queue'] });
const failed = new Gauge({ name: 'queue_failed_count', help: 'Jobs failed', labelNames: ['queue'] });

setInterval(async () => {
  waiting.set({ queue: 'emails' }, await queue.getWaitingCount());
  active.set({ queue: 'emails' }, await queue.getActiveCount());
  failed.set({ queue: 'emails' }, await queue.getFailedCount());
}, 10_000);
The alert that matters here isn't "queue depth above N", it's queue depth growing faster than it drains. A derivative alert:
- alert: QueueGrowingFasterThanItDrains
  expr: deriv(queue_waiting_count[10m]) > 0
  for: 30m
Thirty minutes of monotonic growth is your "we are not keeping up" signal. The fix is either more workers, faster jobs, or accepting backpressure into the API that's enqueuing them.
3. Database connection pool waits. Every Postgres or MySQL pool has a finite number of connections. When all of them are in use and a query asks for one, it waits. Most drivers expose this, pg-pool has pool.waitingCount, mysql2 has pool._connectionQueue.length. If it's ever non-zero for sustained periods, your pool is too small or your queries are too slow. Both are fixable, but you have to see them first.
Throughput Without Latency Is A Lie
Requests per second is the metric on every status page, and on its own it tells you almost nothing. A service can do 5,000 RPS with a p99 of 30ms (great) or 5,000 RPS with a p99 of 8 seconds (a slow-motion outage). Throughput is a denominator, not a number.
What you want is throughput paired with latency percentiles, broken down by route, in the same chart. The shape that matters is whether throughput goes up while latency stays flat. That's healthy scaling. If throughput plateaus while latency climbs, you've hit a bottleneck.
import { Counter, Histogram } from 'prom-client';

const requests = new Counter({
  name: 'http_requests_total',
  help: 'Total HTTP requests',
  labelNames: ['route', 'method', 'status'],
});

const duration = new Histogram({
  name: 'http_request_duration_seconds',
  help: 'HTTP request duration',
  labelNames: ['route', 'method', 'status'],
  // SLO-aligned buckets: tight at the bottom, sparse at the top
  buckets: [0.005, 0.01, 0.025, 0.05, 0.1, 0.25, 0.5, 1, 2.5, 5, 10],
});

export function httpMiddleware(req, res, next) {
  const start = process.hrtime.bigint();
  res.on('finish', () => {
    const route = req.route?.path ?? 'unmatched';
    const labels = { route, method: req.method, status: String(res.statusCode) };
    const seconds = Number(process.hrtime.bigint() - start) / 1e9;
    requests.inc(labels);
    duration.observe(labels, seconds);
  });
  next();
}
Two things to be careful about.
First, buckets. The default prom-client histogram buckets are [0.005, 0.01, 0.025, 0.05, 0.1, 0.25, 0.5, 1, 2.5, 5, 10], which is fine for general APIs. If your service usually responds in under 50ms, you'll lose resolution at the high end of "normal" and have great resolution where nothing ever happens. Pick buckets that bracket your actual latency distribution, not the defaults.
Second, labels. route is fine. Including user_id or request_id will explode your cardinality and crash your Prometheus. Keep label values bounded: status, method, route, version. That's it.
The PromQL that turns this into a useful chart:
# p99 latency per route, last 5 minutes
histogram_quantile(0.99,
  sum by (route, le) (rate(http_request_duration_seconds_bucket[5m]))
)

# requests per second per route
sum by (route) (rate(http_requests_total[1m]))

# error rate per route
sum by (route) (rate(http_requests_total{status=~"5.."}[5m]))
  /
sum by (route) (rate(http_requests_total[5m]))
That's the RED method (Rate, Errors, Duration) and it's what 90% of HTTP service alerting should look like.
Saturation Beats Utilization
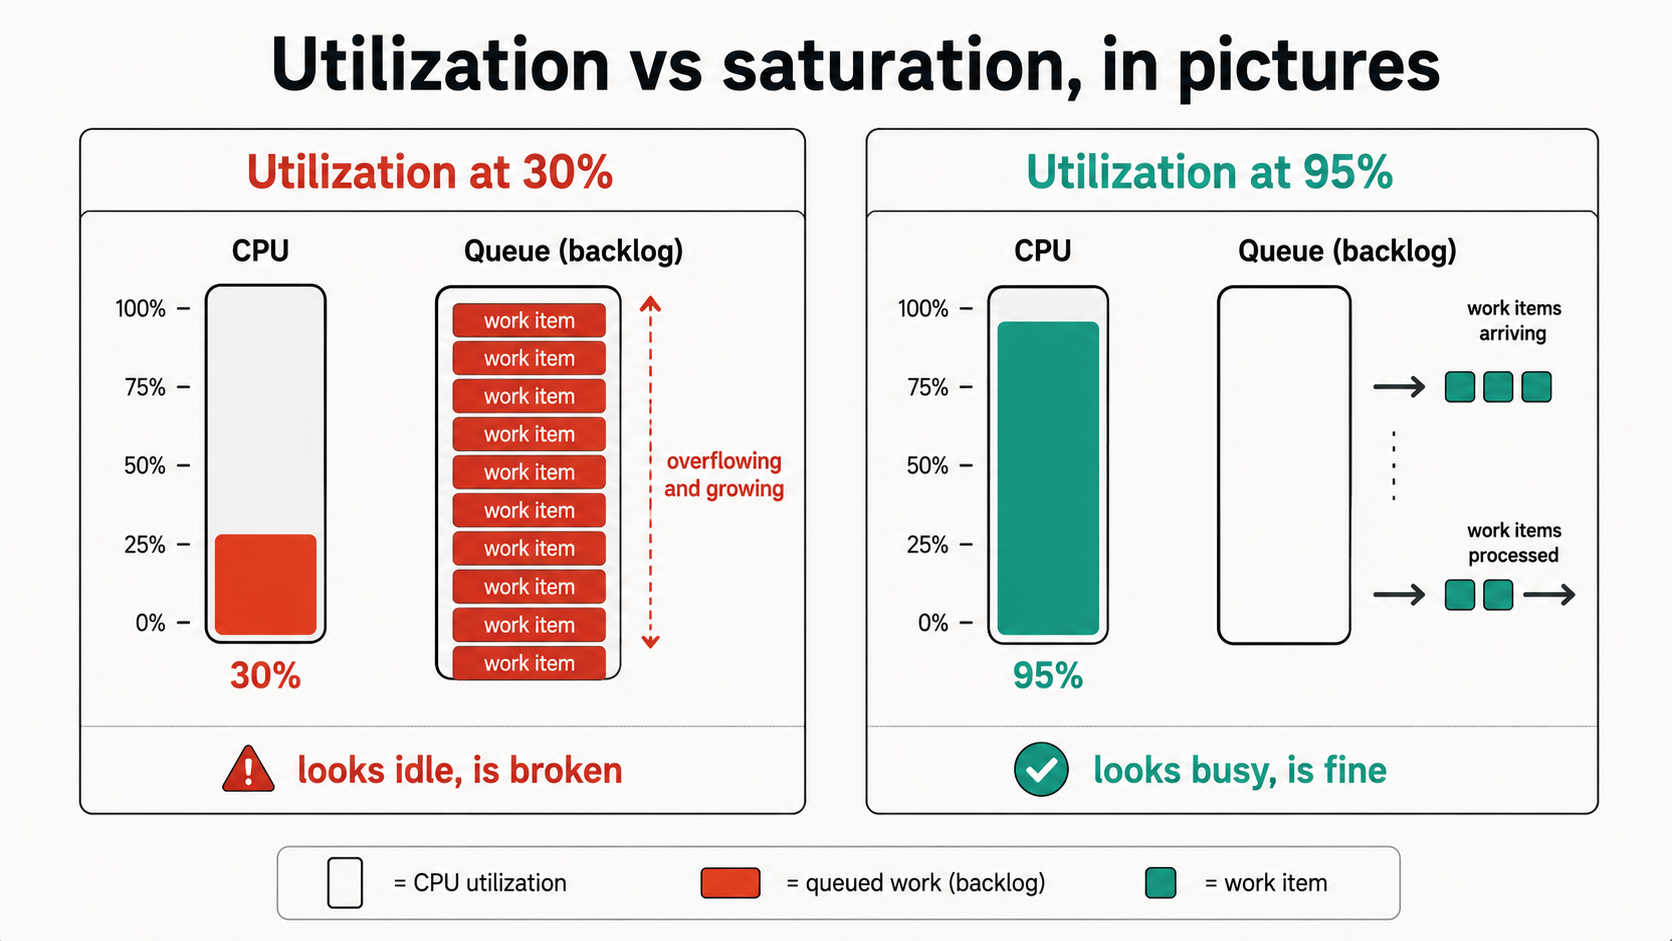
CPU at 80% is the metric every infrastructure team alerts on, and it's the wrong question for a Node.js service.
A single Node process maxes out at one CPU core. If you're running on a 4-core box without clustering, your CPU utilization will plateau at ~25% even when the process is completely saturated. The host looks idle while requests are stacking up. Conversely, a Node service running flat-out at 95% of one core is fine if event loop lag is low and latency is stable.
Utilization tells you "how busy is the resource." Saturation tells you "is work waiting on the resource." For Node, saturation is what you want. The signals:
- Event loop lag (covered above) saturates when the CPU is the bottleneck.
http_requests_in_flightsaturates when handlers are slow.- Queue waiting count saturates when workers can't keep up.
- Pool waiting count saturates when the DB or external service is the bottleneck.
process.memoryUsage().heapUsed / heap_size_limitsaturates when memory is the bottleneck.
Each one points at a different fix. CPU saturation: profile, find the hot function, fix or offload to worker_threads. Handler saturation: find the slow route, fix the query or add caching. Queue saturation: more workers or faster jobs. Pool saturation: bigger pool or faster queries. Heap saturation: find the leak or raise the limit.
Notice what's not on the list: CPU percentage. RAM percentage. Disk I/O. Those are host metrics, useful for capacity planning, not for telling you whether your Node service is in trouble right now.
What To Actually Put On A Dashboard
If you remove every panel that doesn't help during an incident, you end up with about ten:
- Request rate per route, sum by route of
rate(http_requests_total[1m]). - p50 / p95 / p99 latency per route, histogram_quantile of the duration histogram.
- Error rate per route, 5xx as a fraction of total.
- Event loop lag p99, single line, with a 100ms threshold drawn on it.
- Heap used vs heap limit, two lines, with the gap visible.
- GC pause time, major collections only,
nodejs_gc_duration_seconds{kind="major"}. - HTTP requests in flight, by route, saturation signal for the API.
- Queue waiting count, by queue, saturation signal for background jobs.
- DB pool waiting count, saturation signal for the database.
- Process restarts, a simple counter; spikes are leak indicators.
That's the dashboard. Ten panels, each one telling you something specific, each one mapping to a specific fix when it's wrong. Everything else, RSS, libuv handles, FD count, TLS handshakes, ArrayBuffers, goes in the "deep dive" tab. You'll open it twice a year, and you'll be glad it's there when you need it.
The principle underneath all of this: a metric earns its place on the main dashboard by changing your behaviour during an incident. If a chart only ever gets glanced at and never acted on, it's not a metric, it's wallpaper. Take it down.
Pick the five from the title and the dashboard above, alert only on the ones that map to a real on-call action, and put the rest behind a click. Your future on-call self will thank you.