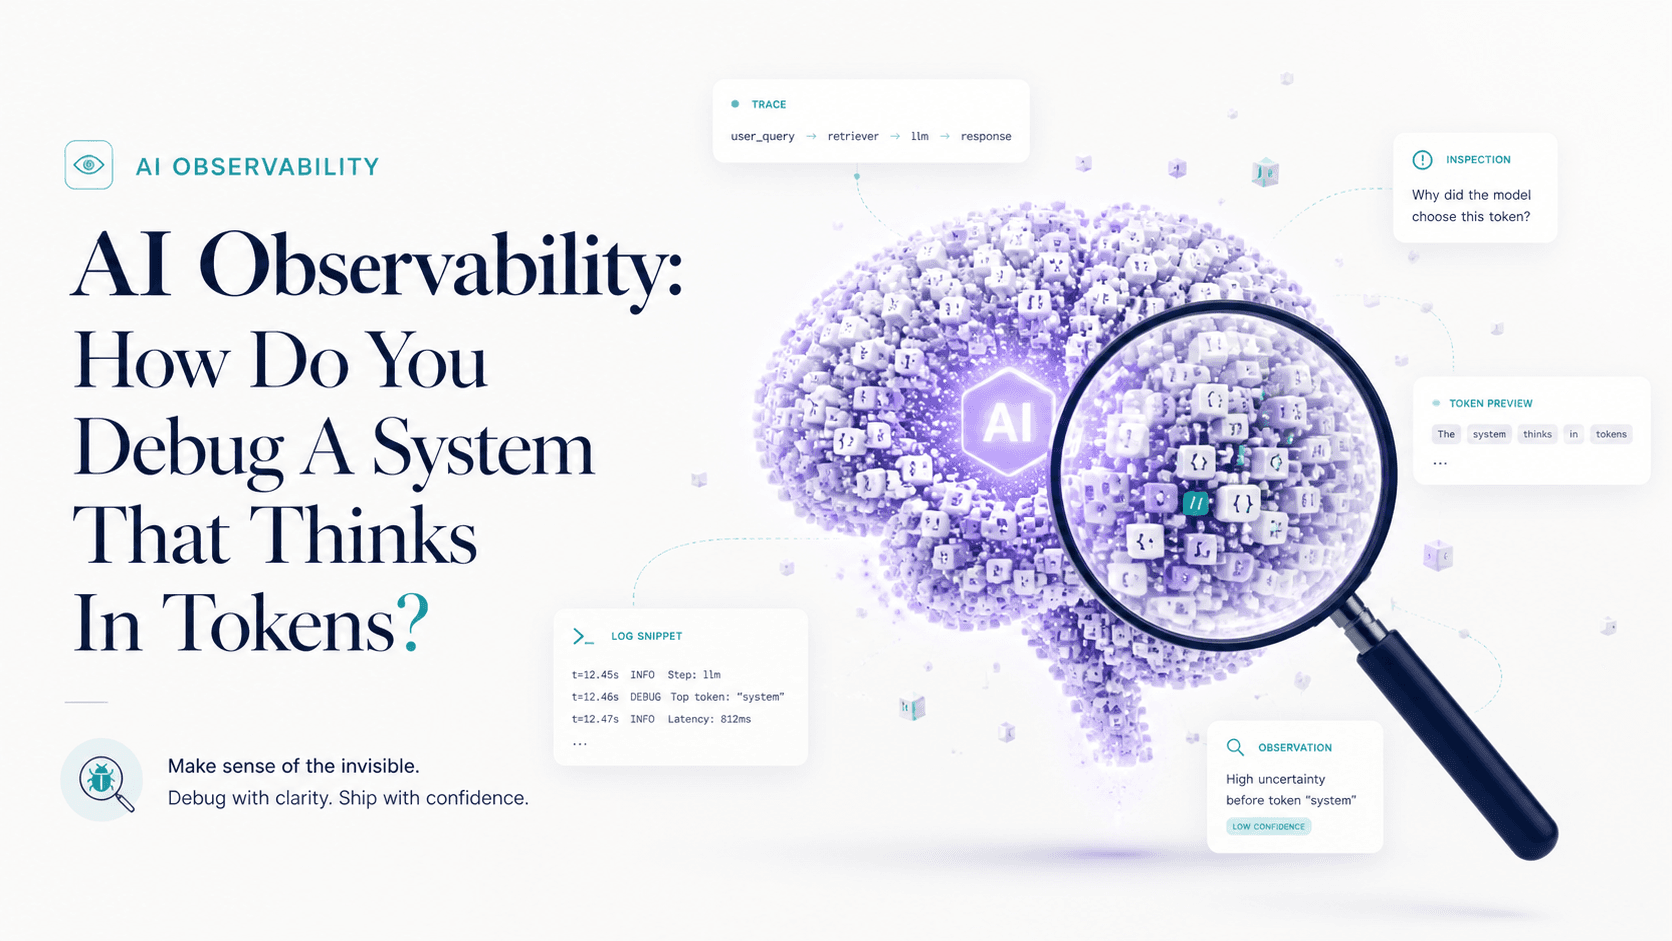
When a normal web app breaks, it tends to be loud. A 500 in the logs, a stack trace in Sentry, an alert in PagerDuty. You know within minutes that something is wrong, and you usually know the line of code that did it.
When an AI feature breaks, it tends to be quiet. The model returns confidently. The HTTP status is 200. The structured output validates. The user just gets a slightly-wrong answer and either gives up, complains in the in-app chat three days later, or — worst case — acts on it. Your dashboards look fine. Your error rate is zero. The feature is failing 4% of the time and you have no signal at all.
This is why observability isn't a "we'll add it once we have traffic" thing for AI. It's the day-one infrastructure that makes the thing debuggable at all. Without it, you're building a system whose failures are invisible by default.
The Three Things Worth Capturing
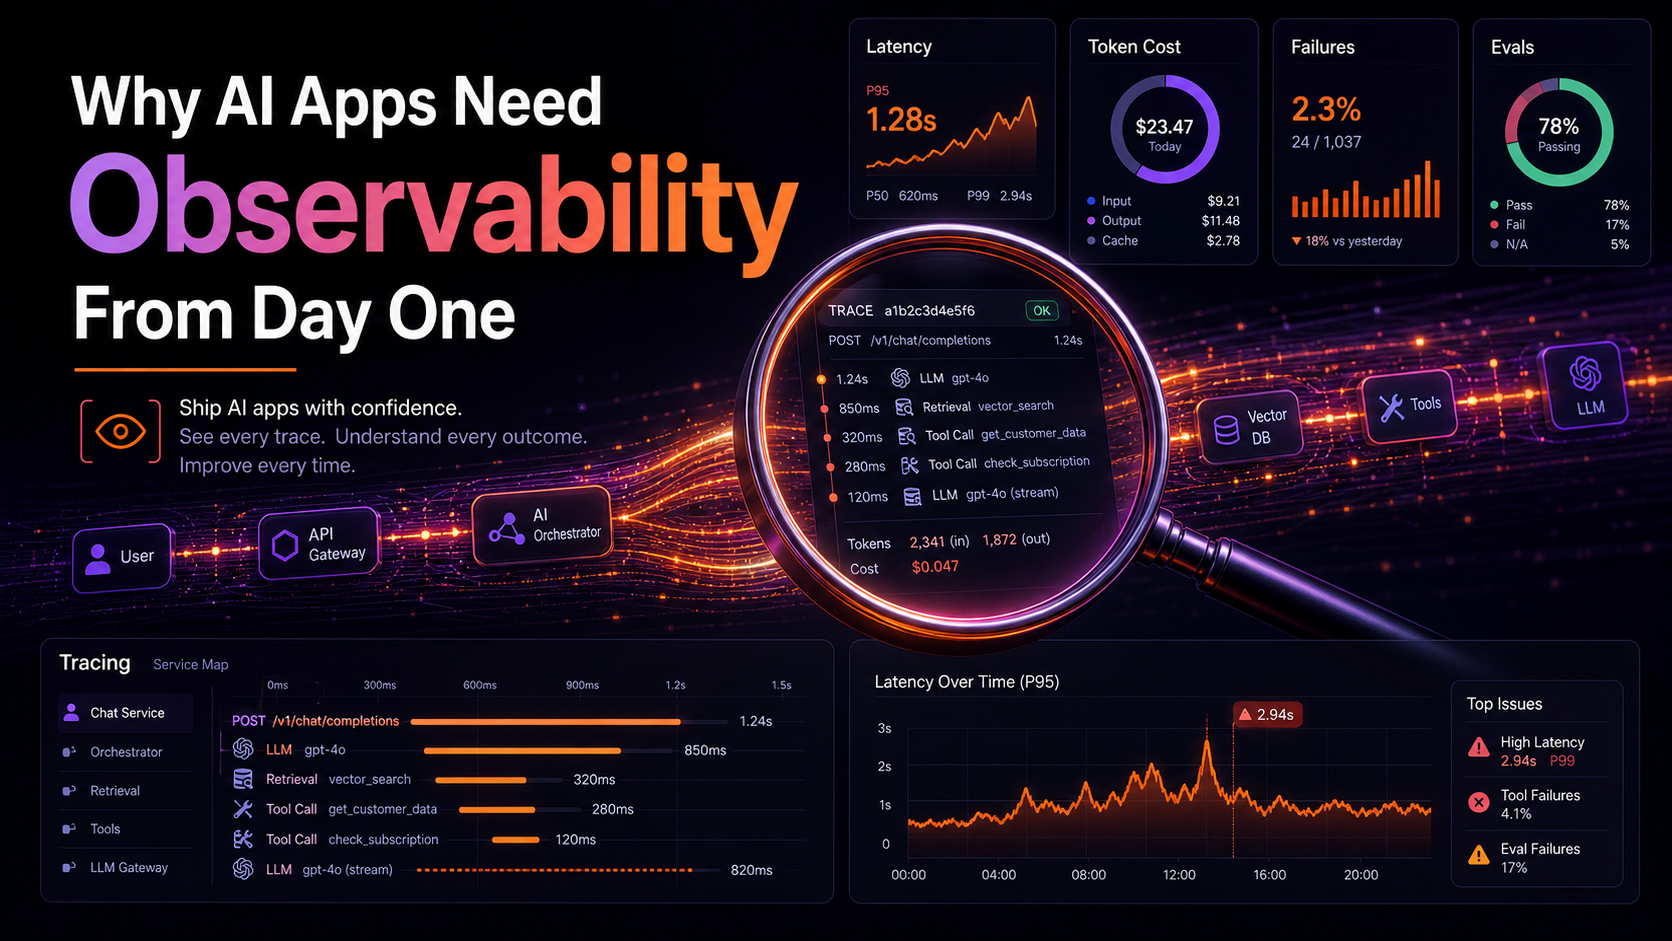
Traditional observability is metrics, logs, and traces. AI observability is a specialized version of those, and the things you actually want to see are:
- The prompt that went to the model. System message, user messages, tool results, retrieved context — the full payload as the model saw it. Not "the user typed this in the textbox." The version after your prompt template, after RAG retrieval, after the previous tool call.
- The response the model returned. Full text, plus structured output if any, plus tool calls the model decided to make.
- Cost and shape. Input tokens, output tokens, cost in cents, time-to-first-token, total duration, model used, provider, request ID from the provider.
Skip any of these and your debugging story has a hole in it. The prompt is the only thing that lets you reproduce the failure. The response is the only thing that lets you tell whether the failure was in the model or in your post-processing. The cost data is the only thing that catches the silent 10x bill.
The Vercel AI SDK Has A Telemetry Hook
If you're using the AI SDK, you don't have to instrument from scratch. Every streamText, generateText, generateObject, and streamObject call accepts experimental_telemetry, which emits OpenTelemetry spans following the GenAI semantic conventions. That means any OTel-compatible backend (Langfuse, Braintrust, Honeycomb, Datadog, your own Tempo) sees your AI calls as first-class spans.
import { generateText } from "ai";
import { openai } from "@ai-sdk/openai";

const { text } = await generateText({
  model: openai("gpt-4o-mini"),
  prompt,
  experimental_telemetry: {
    isEnabled: true,
    functionId: "support.classify",
    metadata: { userId, ticketId, env: process.env.NODE_ENV },
  },
});
The functionId shows up in your traces as the span name, so you can group and filter by feature instead of by raw model call. metadata flows into span attributes — keep it free of PII you wouldn't put in a normal log.
Structured Logs, Not String Concatenation
Even before you wire up a real telemetry backend, structured JSON logs solve 80% of the problem. The rule is: one line per event, JSON, with a stable shape, including a traceId you can grep across services.
type AiEvent = {
  ts: string;
  traceId: string;
  feature: string;
  event: "request" | "response" | "error";
  durationMs?: number;
  inputTokens?: number;
  outputTokens?: number;
  costCents?: number;
  model?: string;
  errorKind?: string;
};

function logAi(e: AiEvent) {
  console.log(JSON.stringify(e));
}

export async function classify(text: string, userId: string) {
  const traceId = crypto.randomUUID();
  const start = performance.now();
  logAi({ ts: new Date().toISOString(), traceId, feature: "classify", event: "request" });
  try {
    const { object, usage } = await generateObject({
      model: openai("gpt-4o-mini"),
      schema: TicketSchema,
      prompt: text,
    });
    logAi({
      ts: new Date().toISOString(),
      traceId,
      feature: "classify",
      event: "response",
      durationMs: performance.now() - start,
      inputTokens: usage.inputTokens,
      outputTokens: usage.outputTokens,
      model: "gpt-4o-mini",
    });
    return object;
  } catch (err) {
    logAi({
      ts: new Date().toISOString(),
      traceId,
      feature: "classify",
      event: "error",
      durationMs: performance.now() - start,
      errorKind: err instanceof Error ? err.name : "unknown",
    });
    throw err;
  }
}
That's enough to ingest into CloudWatch, Datadog, Loki, or whatever you already use, and to build a dashboard that answers "what did the classify feature do today, and how much did it cost." The shape matters more than the storage — once events have a traceId and a stable schema, you can move them between systems later.

The Tool Call You Wish You Had: Replay
The single feature that separates "logs" from "AI observability" is replay — taking a captured trace and re-running it against a different prompt, model, or version of your retrieval. You can build a primitive version yourself: store the input messages, the retrieved context, and the model parameters as a JSON blob, and write a small script that re-runs them. That's enough to debug "why did this user get this answer."
Tools like Langfuse, Braintrust, and Helicone do this out of the box, plus they give you eval datasets — turn a captured trace into a test case, run it across model versions, and see whether your "improvement" actually wins or quietly regresses on the long tail. PostHog now has LLM analytics built into its product analytics layer, which is useful if you already track product events there and don't want a separate dashboard.
Don't Log What You Wouldn't Show A Lawyer
A trace that contains the user's prompt also contains anything they typed — passwords pasted in by mistake, customer PII, internal-only document text. Treat AI logs the same way you treat application logs: redact secrets, scrub PII before storage, set retention policies, and keep them out of pre-production environments where access controls are looser. If your provider has a "don't train on my data" or "zero data retention" agreement, configure it. Your observability tool needs the same agreement.
A reasonable default for sensitive products: log the shape (token counts, model, latency, error kind, a content hash) by default, and only log full prompts/responses for opted-in debug sessions or for the small percentage of requests you sample for evals.
Alerts You Actually Want
Once you have the data, three alerts cover most real failure modes:
- Cost per hour above threshold. A prompt change that 5x's tokens shows up here within minutes, not at the end of the month.
- Schema-validation error rate above threshold. When
generateObjectstarts failing, your model has drifted, your schema has drifted, or someone changed the prompt. All three are worth knowing about today. - P95 latency above threshold. Time-to-first-token is the user-perceived metric. P95 going from 2s to 8s is a real product regression that you would otherwise discover via a support ticket.
Don't bother alerting on the model returning the "wrong" answer — that's an evals problem, not a metrics problem, and the answer is to run an eval suite on every prompt change, not to put a correctness gauge in PagerDuty.
A One-Sentence Mental Model
AI observability is just regular observability with the prompt and the response treated as first-class artifacts — wire it up on day one, log structured events with a trace ID, sample full payloads for replay, and don't pretend that a 200 status code means the feature worked.