So, you've shipped a Go service. It's running in prod. It's mostly fine. Then one Tuesday afternoon, the on-call channel lights up - p95 latency on /checkout has tripled, your dashboard says "everything's green-ish", and your boss is asking which team's fault it is. You SSH into a pod, you tail -f something, you squint at the logs, you find a line that says slow request, and you're not even sure if it's the same request anyone's complaining about.
That feeling - the gap between "I can see something is wrong" and "I know exactly what's wrong" - is what observability is supposed to close.
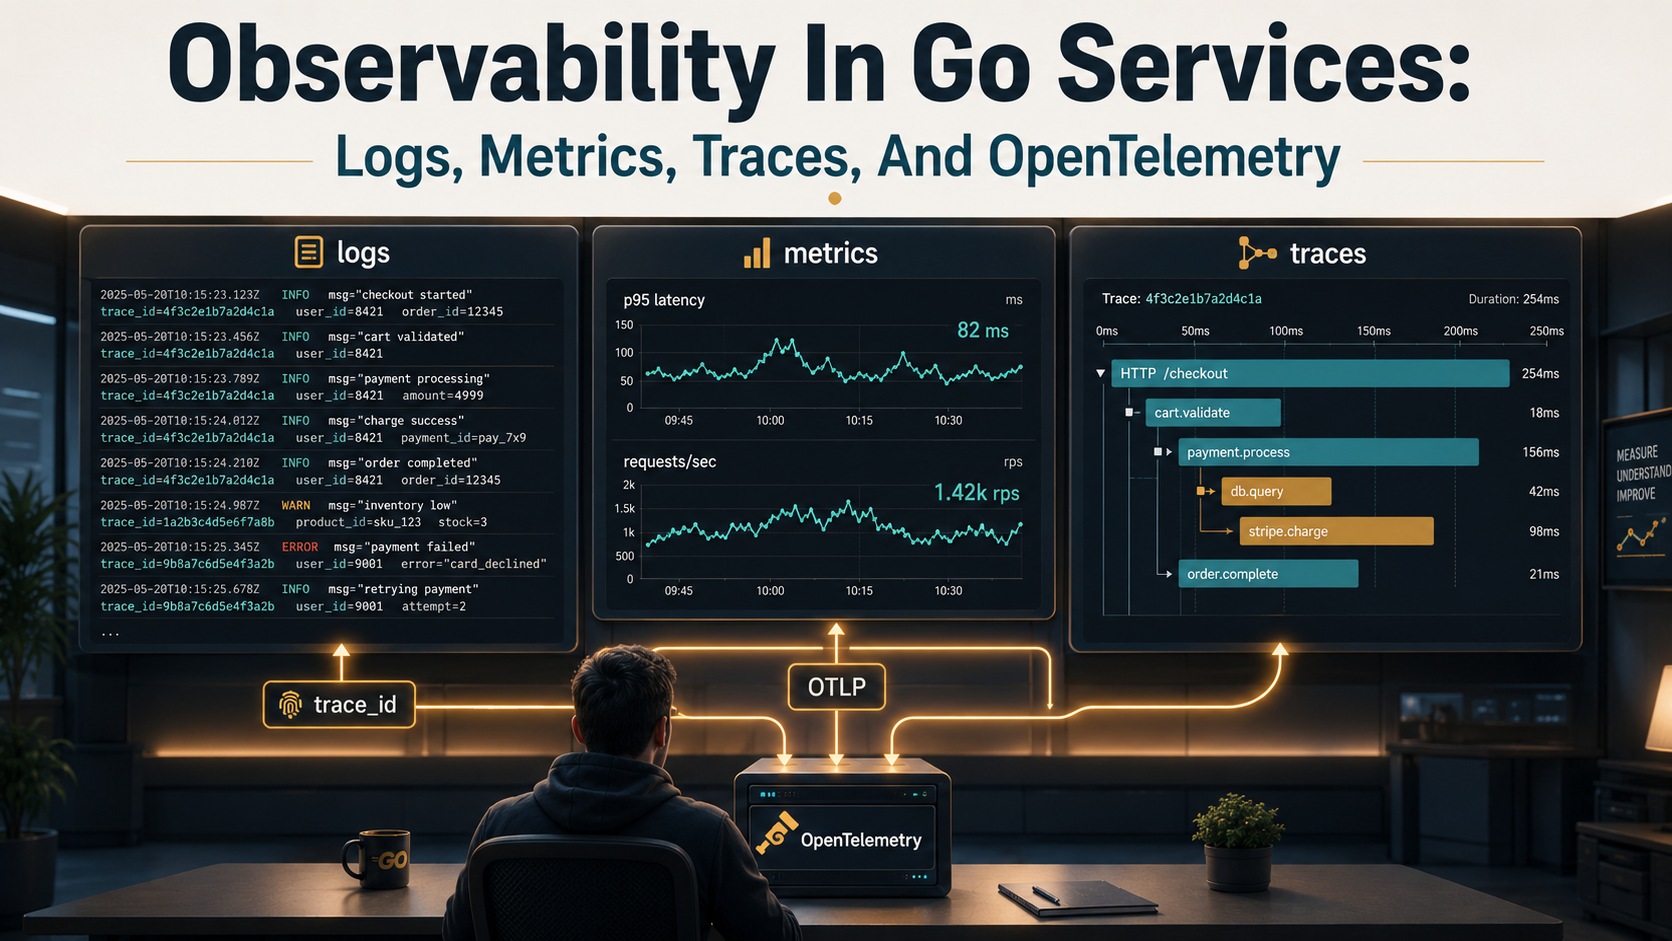
This piece is a working tour of the three pillars in Go: logs, metrics, traces. We'll write each of them with real code, we'll wire them through OpenTelemetry, and we'll talk about where each one breaks down. No vendor sales pitch, no abstract theory - just the version a backend engineer needs to be dangerous with at 3am.
The three pillars (and what each one actually buys you)
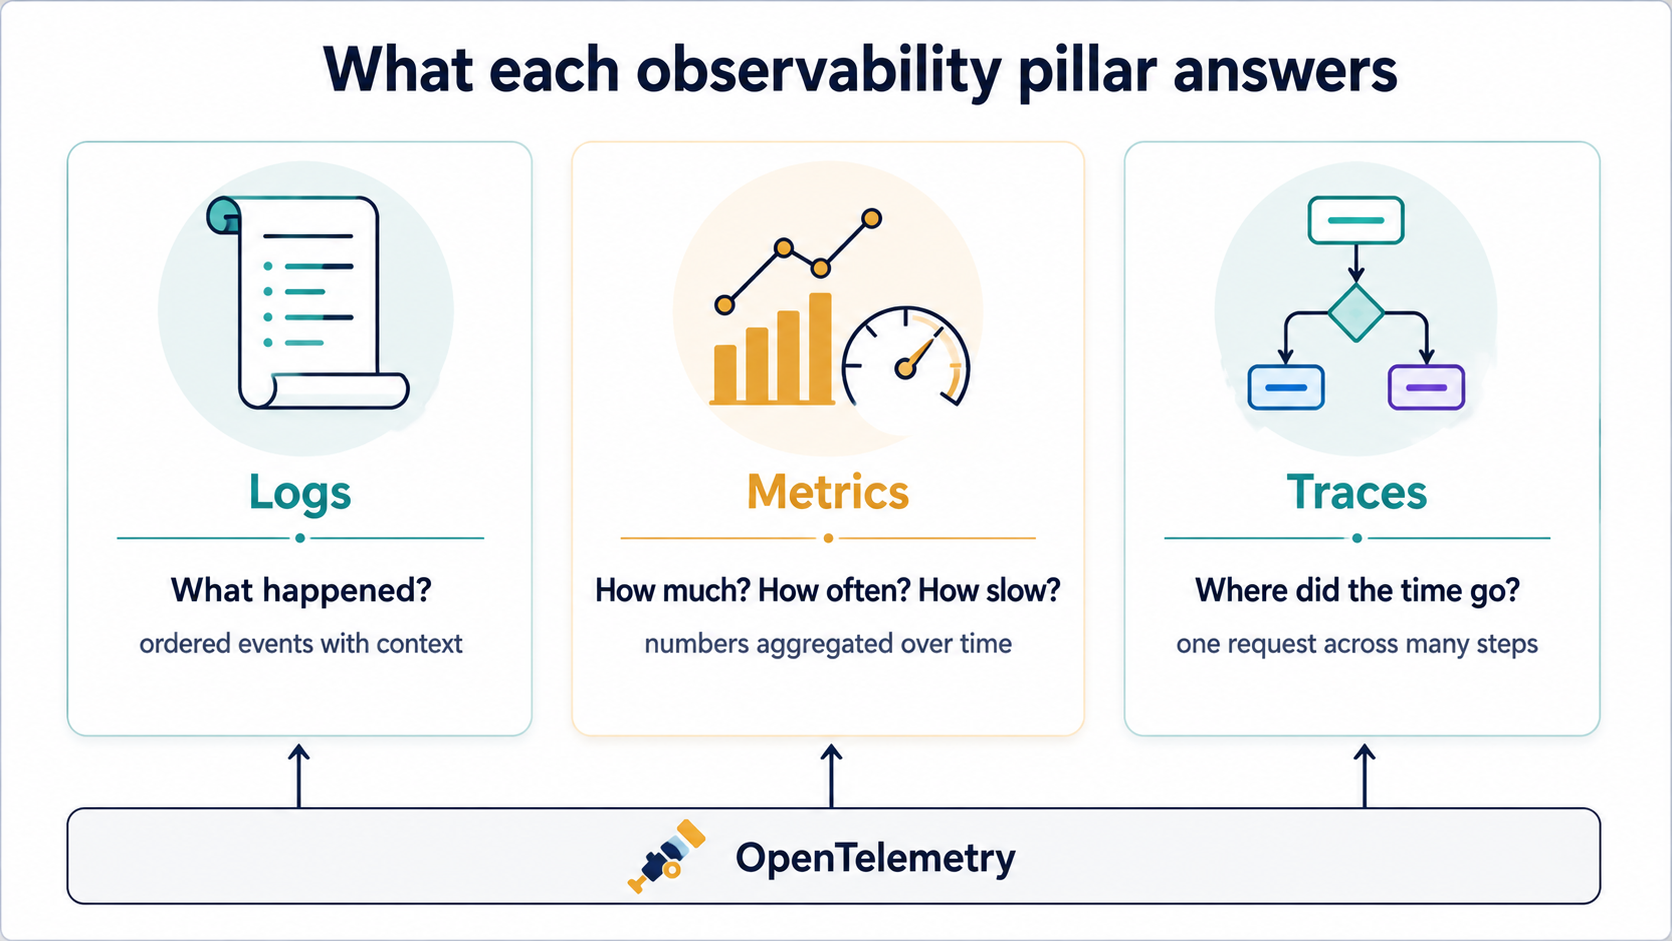
You'll hear "the three pillars" a lot. It sounds like marketing, but the split is real, because each pillar answers a different question.
- Logs answer what happened? They're the narrative. A line per event, ordered in time, attached to whatever context you remembered to include.
- Metrics answer how much, how often, how slow? They're numbers over time. A counter goes up, a gauge moves around, a histogram tells you the shape of a latency distribution.
- Traces answer where did the time go? They follow one request across many functions, goroutines, and services, and they show you which step ate the budget.
You can survive on one pillar for a while. Most services start with logs alone. But if you're trying to debug a slow request in a service that fans out to three other services, logs by themselves will make you cry. Metrics will tell you the latency is high but won't tell you which step caused it. You need all three, and you need them to connect.
We'll start with the one you already use.
Logs in Go: the narrative
Go used to have a logging story that was mostly a meme. The stdlib log package gave you a Print and a Fatalf and called it a day. Everyone reached for logrus or zap or zerolog, half the services in your org used a different one, and "structured logging" meant whatever the team felt like that quarter.
Then Go 1.21 added log/slog and the conversation more or less ended. It's structured, it's in the stdlib, and it's good enough that you only need to add a library if you have a very specific reason.
Here's the baseline:
package main

import (
    "log/slog"
    "os"
)

func main() {
    logger := slog.New(slog.NewJSONHandler(os.Stdout, &slog.HandlerOptions{
        Level: slog.LevelInfo,
    }))
    slog.SetDefault(logger)

    slog.Info("service started", "version", "1.4.2", "port", 8080)
}
That emits a single JSON line:
{"time":"2026-05-15T10:31:02.114Z","level":"INFO","msg":"service started","version":"1.4.2","port":8080}Two things to notice. First, the message (service started) and the structured fields (version, port) are separate. You search and filter on the fields, you read the message. Second, the output is JSON because that's what your log shipper - Loki, Elasticsearch, whatever - is actually going to parse. The "pretty" text handler is for local dev only.
Once you have that, the day-to-day pattern is to attach context as you go:
func handleCheckout(w http.ResponseWriter, r *http.Request) {
    userID := r.Header.Get("X-User-Id")
    log := slog.With(
        "user_id", userID,
        "request_id", r.Header.Get("X-Request-Id"),
    )

    log.Info("checkout started")
    // ... business logic ...
    if err := charge(r.Context(), userID); err != nil {
        log.Error("charge failed", "err", err)
        http.Error(w, "payment declined", http.StatusPaymentRequired)
        return
    }
    log.Info("checkout completed")
}
slog.With makes a child logger with extra fields. Every log line from that point on carries user_id and request_id whether you remember to add them or not. This is the single biggest unlock - logs without consistent context are just noise pointed at the future.
Where logs fall apart
Logs are great until you have a lot of them. Three failure modes show up in roughly this order:
- Lookup cost. "Find me all the logs for request 7abc-..." across 40 pods means your log backend has to scan a lot of data. Without a real indexed backend (Loki, Elasticsearch, Datadog, anything that builds a label index), this is going to be slow.
- No aggregation. "How many
charge failedlines per minute over the last hour, grouped by error code?" is technically possible with logs, but you're abusing them. That's metrics. - No timeline. "Out of these 6 service calls, which one was slow?" is technically derivable from logs, but you'd have to reconstruct it by hand from timestamps and request IDs. That's traces.
Each of those failure modes is the reason the next pillar exists.
Metrics in Go: the dashboard
A metric is a number you can plot. The interesting thing isn't the number itself - it's how it changes over time, and how it splits by attribute.
Three flavours cover roughly 90% of real-world cases:
- Counter: monotonic, only goes up. Requests handled, errors emitted, jobs enqueued. You plot the rate.
- Gauge: a value that goes up and down. Open DB connections, queue depth, goroutines. You plot the level.
- Histogram: a distribution of values. Request latency, payload size, retry counts. You plot p50/p95/p99.
The historical Go answer was the Prometheus client library. It works, half the world still uses it, and there's nothing wrong with it. But OpenTelemetry now has a first-class metrics API in Go and it plays well with the same tracing setup you'll do in the next section, so we'll use it.
package metrics

import (
    "go.opentelemetry.io/otel"
    "go.opentelemetry.io/otel/metric"
)

var (
    meter           = otel.Meter("checkout-service")
    RequestsHandled metric.Int64Counter
    OpenDBConns     metric.Int64UpDownCounter
    RequestLatency  metric.Float64Histogram
)

func Init() error {
    var err error

    RequestsHandled, err = meter.Int64Counter(
        "http.server.requests",
        metric.WithDescription("Requests handled by the HTTP server"),
        metric.WithUnit("{request}"),
    )
    if err != nil {
        return err
    }

    OpenDBConns, err = meter.Int64UpDownCounter(
        "db.connections.open",
        metric.WithDescription("Open database connections"),
    )
    if err != nil {
        return err
    }

    RequestLatency, err = meter.Float64Histogram(
        "http.server.duration",
        metric.WithDescription("HTTP server request duration"),
        metric.WithUnit("s"),
    )
    return err
}
Int64Counter is your counter, Int64UpDownCounter is the closest thing OTel has to a gauge from synchronous code, Float64Histogram is the histogram. Names follow a noun.verb shape with dots; this matches the OpenTelemetry semantic conventions so any backend reading them knows what http.server.duration is.
Recording is one line per event:
import (
    "time"

    "go.opentelemetry.io/otel/attribute"
    "go.opentelemetry.io/otel/metric"
)

func handleCheckout(w http.ResponseWriter, r *http.Request) {
    start := time.Now()
    defer func() {
        metrics.RequestLatency.Record(r.Context(),
            time.Since(start).Seconds(),
            metric.WithAttributes(
                attribute.String("http.method", r.Method),
                attribute.String("http.route", "/checkout"),
            ),
        )
    }()
    // ... handler body ...
    metrics.RequestsHandled.Add(r.Context(), 1,
        metric.WithAttributes(
            attribute.String("http.method", r.Method),
            attribute.String("http.route", "/checkout"),
        ),
    )
}
The cardinality trap
This is the part where new metrics code shoots its own foot. Every unique combination of attribute values is a separate time series in your backend. If you tag every metric with user_id, and you have a million users, you get a million time series for that one metric. Prometheus will fall over, your bill will go up, your dashboards will time out.
Rules of thumb that survive contact with production:
- Attribute values must be low cardinality and bounded.
http.method(GET, POST, PUT, ...) is fine.http.routeis fine if you use the route template (/users/:id), not the actual path (/users/12345).user_id,request_id, full URLs, error messages with stack traces - never in metric attributes. - If you find yourself wanting
user_idon a metric, that's a sign you actually want a log line or a trace, not a metric. Use those for high-cardinality stuff. - Use the histogram for latency, not a gauge of "last request duration". A gauge throws away every value but the last; a histogram preserves the distribution.
Traces in Go: the timeline
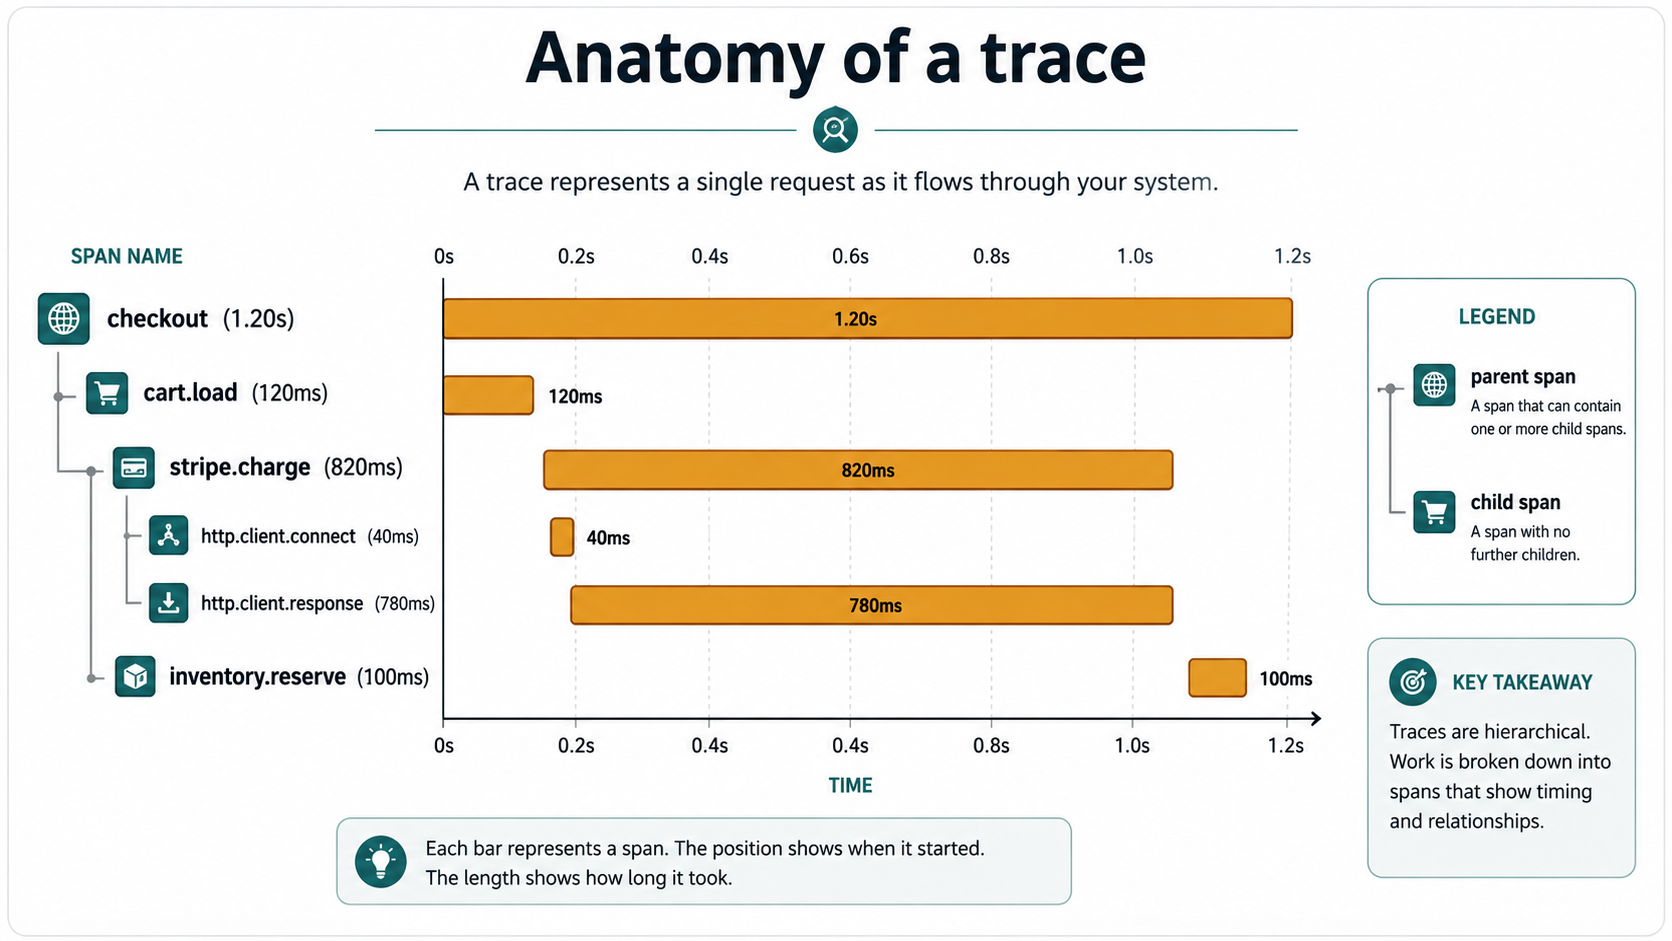
A trace is one request, end to end. A span is one step within that trace. A trace is a tree (or DAG) of spans, with timestamps and parent/child relationships. When you look at a trace in Jaeger or Tempo, you see a waterfall: the root span at the top, with child spans nested under it, each one a horizontal bar showing when it started, how long it took, and what happened in it.
package checkout

import (
    "context"

    "go.opentelemetry.io/otel"
    "go.opentelemetry.io/otel/attribute"
    "go.opentelemetry.io/otel/codes"
)

var tracer = otel.Tracer("checkout-service")

func handleCheckout(ctx context.Context, userID string) error {
    ctx, span := tracer.Start(ctx, "checkout")
    defer span.End()

    span.SetAttributes(attribute.String("user.id", userID))

    if err := loadCart(ctx, userID); err != nil {
        span.RecordError(err)
        span.SetStatus(codes.Error, "load cart failed")
        return err
    }

    if err := chargeStripe(ctx, userID); err != nil {
        span.RecordError(err)
        span.SetStatus(codes.Error, "stripe charge failed")
        return err
    }

    return nil
}

func loadCart(ctx context.Context, userID string) error {
    _, span := tracer.Start(ctx, "cart.load")
    defer span.End()
    // ... db query ...
    return nil
}

func chargeStripe(ctx context.Context, userID string) error {
    _, span := tracer.Start(ctx, "stripe.charge")
    defer span.End()
    // ... http call ...
    return nil
}
A few things hidden in there that matter:
tracer.Start(ctx, "...")returns a newctxthat carries the span. You have to pass that ctx down. If you callloadCart(ctx, ...)with the parent ctx, the child span has no parent and your trace falls apart.defer span.End()is the trick that makes timing automatic - the span's duration isEnd - Start, anddeferguarantees it fires even if the function panics.span.RecordError(err)andspan.SetStatus(codes.Error, "...")are how you tag a failure. Without them, the span looks "successful" in your tracing UI even if your function returned an error.
The result, when rendered, is a waterfall like this:
checkout                       [============================] 1.2s
├── cart.load                  [====]                          0.18s
├── stripe.charge              [=================]             0.74s
│   ├── http.client.connect    [==]                            0.08s
│   └── http.client.response   [============]                  0.62s
└── inventory.reserve          [==]                            0.09s
That picture is what you can't get from logs or metrics alone. Logs would tell you each step ran. Metrics would tell you total latency was 1.2s. The waterfall tells you stripe.charge ate most of the budget, and inside it, the response wait took 0.62s. Now you know who to blame.
Context propagation - the part that breaks
Inside one Go service, the trace just rides along on the context.Context. Cross-service, you have to actually serialize the trace ID over the wire and have the other side pick it up.
For an outgoing HTTP call, this is the move:
import (
    "net/http"

    "go.opentelemetry.io/contrib/instrumentation/net/http/otelhttp"
)

client := http.Client{
    Transport: otelhttp.NewTransport(http.DefaultTransport),
}
otelhttp.NewTransport wraps your transport, starts a child span around each outgoing request, and injects the trace context into the HTTP headers (traceparent, tracestate) using whatever propagator you've configured.
On the server side, the equivalent:
import (
    "net/http"

    "go.opentelemetry.io/contrib/instrumentation/net/http/otelhttp"
)

mux := http.NewServeMux()
mux.Handle("/checkout", otelhttp.NewHandler(http.HandlerFunc(handleCheckout), "POST /checkout"))
http.ListenAndServe(":8080", mux)
otelhttp.NewHandler extracts the trace context from the incoming headers, starts a server-side root span (or continues an upstream trace), and attaches it to the request's context. Your handler then calls r.Context(), passes it to your business code, and the rest of the spans hang off it correctly.
If you forget the propagator setup, none of this works - you get isolated single-service traces with no parent links. The single line that fixes it:
import (
    "go.opentelemetry.io/otel"
    "go.opentelemetry.io/otel/propagation"
)

otel.SetTextMapPropagator(propagation.NewCompositeTextMapPropagator(
    propagation.TraceContext{},
    propagation.Baggage{},
))
Set that once at startup. Forget it and you'll spend an hour wondering why your traces "don't link across services" before someone points at this missing line.
Wiring it through OpenTelemetry
So far we've been calling into OTel APIs without saying where the data actually goes. The story is:
- Your code calls the OTel API (
tracer.Start,counter.Add, ...). - The OTel SDK in your process collects those calls, batches them, and turns them into a wire format.
- An exporter sends the batches over the network - usually via OTLP, OpenTelemetry's protocol - to a collector or directly to a backend.
- The collector (optional but common) fans the data out to whatever backends you use - Prometheus for metrics, Tempo or Jaeger for traces, Loki or Elasticsearch for logs.
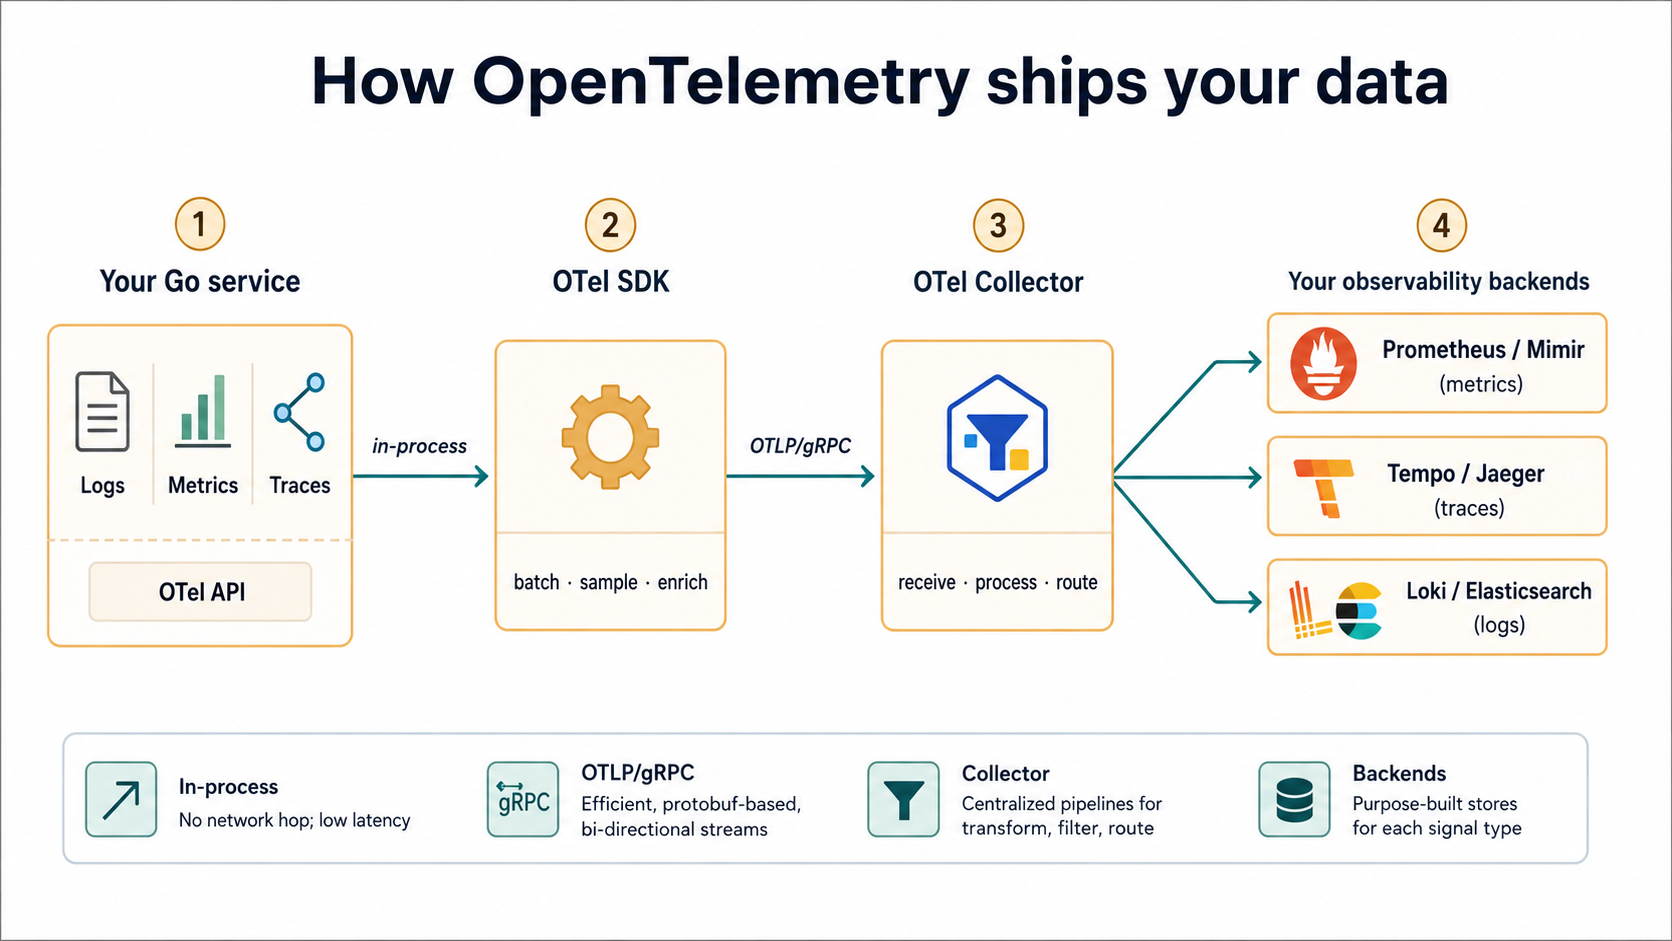
For a small service, you can skip the collector and have the SDK push directly to the backend. For anything you care about - multiple services, multiple backends, anything where you want a consistent place to do sampling and redaction - put a collector in the middle.
Here's a minimal startup wiring for traces and metrics over OTLP:
package otel

import (
    "context"
    "time"

    "go.opentelemetry.io/otel"
    "go.opentelemetry.io/otel/exporters/otlp/otlpmetric/otlpmetricgrpc"
    "go.opentelemetry.io/otel/exporters/otlp/otlptrace/otlptracegrpc"
    "go.opentelemetry.io/otel/propagation"
    sdkmetric "go.opentelemetry.io/otel/sdk/metric"
    "go.opentelemetry.io/otel/sdk/resource"
    sdktrace "go.opentelemetry.io/otel/sdk/trace"
    semconv "go.opentelemetry.io/otel/semconv/v1.26.0"
)

func Setup(ctx context.Context, serviceName, version string) (func(context.Context) error, error) {
    res, err := resource.New(ctx,
        resource.WithAttributes(
            semconv.ServiceName(serviceName),
            semconv.ServiceVersion(version),
        ),
    )
    if err != nil {
        return nil, err
    }

    traceExp, err := otlptracegrpc.New(ctx)
    if err != nil {
        return nil, err
    }
    tp := sdktrace.NewTracerProvider(
        sdktrace.WithBatcher(traceExp),
        sdktrace.WithResource(res),
    )
    otel.SetTracerProvider(tp)

    metricExp, err := otlpmetricgrpc.New(ctx)
    if err != nil {
        return nil, err
    }
    mp := sdkmetric.NewMeterProvider(
        sdkmetric.WithReader(sdkmetric.NewPeriodicReader(metricExp,
            sdkmetric.WithInterval(10*time.Second),
        )),
        sdkmetric.WithResource(res),
    )
    otel.SetMeterProvider(mp)

    otel.SetTextMapPropagator(propagation.NewCompositeTextMapPropagator(
        propagation.TraceContext{},
        propagation.Baggage{},
    ))

    return func(ctx context.Context) error {
        err1 := tp.Shutdown(ctx)
        err2 := mp.Shutdown(ctx)
        if err1 != nil {
            return err1
        }
        return err2
    }, nil
}
Three patterns here are worth lifting straight into your service:
- The
resourcecarries the service-level metadata (service.name,service.version) that every trace and metric inherits. Without it, your backend has no idea which service emitted a span. Use thesemconvconstants - they match the OpenTelemetry semantic conventions so your dashboards work without renaming everything. WithBatcheris the production choice - it buffers spans and flushes them in batches. There's aWithSyncerthat sends one at a time, useful for tests, terrible for prod.- The shutdown function. Flush before exit, or you'll lose the last batch of spans every time the service restarts. Call it from your signal handler or
deferit inmain.
The OTLP exporters read OTEL_EXPORTER_OTLP_ENDPOINT from the environment by default, so you don't pass URLs in code. OTEL_EXPORTER_OTLP_ENDPOINT=http://otel-collector:4317 and the SDK does the right thing.
Logs through OTel too
The OTel logs API in Go went stable, and there's a slog bridge that turns log/slog calls into OTel log records. The cleanest setup:
import (
    "log/slog"

    "go.opentelemetry.io/contrib/bridges/otelslog"
)

logger := otelslog.NewLogger("checkout-service")
slog.SetDefault(logger)
The bridge takes every slog call and turns it into an OTel log record. From there, the same OTLP exporter mechanism ships it alongside your traces and metrics. The benefit isn't shorter code - it's that the log record carries the active span's trace_id and span_id automatically, so a backend that knows about both (Datadog, Grafana, Honeycomb, ...) can show you the matching trace from a log line.
Where the pillars connect
This is the payoff. Each pillar on its own is useful. The thing that makes a senior engineer faster than a junior one at 3am is the path between them.
The path looks like this:
- Metric tells you something is wrong. "
http.server.durationp99 on/checkoutjumped from 200ms to 2.4s in the last 15 minutes." You see a chart, not a request. - Exemplar or query drops you onto a representative slow trace. Modern setups (Prometheus + Tempo, Mimir + Tempo, Datadog APM) attach exemplars to histogram buckets - a sampled
trace_idrepresenting a request that landed in that bucket. One click takes you to the trace. - Trace shows you the slow span. "
stripe.chargewaited 1.9s on the network." Now you know which step was slow. - Log explains it. With
trace_idindexed in your log backend, you query fortrace_id=abc...and pull the structured log lines emitted while that trace was running. "stripe API returned 429 retry-after=2." Now you know why.
That's the path. Metric → trace → log, from coarse to fine. The single technical requirement is that the same trace_id must show up in all three.
If you're using otelslog, you get it for free in logs. If you're not, add it manually:
import "go.opentelemetry.io/otel/trace"

span := trace.SpanFromContext(ctx)
if sc := span.SpanContext(); sc.IsValid() {
    log = log.With(
        "trace_id", sc.TraceID().String(),
        "span_id", sc.SpanID().String(),
    )
}
Stick that in the same place you build your per-request logger and your logs are trace-aware everywhere.
Sampling, costs, and the part nobody warns you about
The day you turn on tracing in a high-traffic service, you'll learn something the OTel docs mention almost in passing: traces are not free. Every span is a network call's worth of data, give or take. A service doing 10k requests per second with 8 spans per request is 80k spans per second. At any non-trivial scale, your tracing backend or your bill (or both) will protest.
The fix is sampling. Two flavours, both supported:
- Head sampling. The SDK decides at the start of the trace whether to keep it, based on a fixed ratio (e.g. 1%). Cheap, but you lose the long tail of slow requests because they look like every other dropped trace.
- Tail sampling. The collector buffers the whole trace, then decides - keep all errors, keep anything over 1s, keep 1% of the rest. Much more useful, much more expensive to run. Lives in the collector, not the SDK.
For most services, start with sdktrace.WithSampler(sdktrace.TraceIDRatioBased(0.1)) on the SDK side, and turn on tail sampling in the collector when you actually need the long-tail captures. Don't sample at 100% in production unless you have a very specific reason and a very specific budget.
Metrics are different - they're already aggregated, so cardinality is the cost lever, not sampling. Logs are different again - you usually keep all of them at low levels in prod (info+, sometimes debug), but you index a subset and store the rest cheaply.
When to reach for each pillar
Most observability mistakes are about reaching for the wrong pillar.
- You want to alert on something? That's a metric. Don't alert on log lines unless you genuinely have nothing else.
- You want to count how often something happens? Metric.
- You want to explain what happened to one specific request? Log + trace, in that order.
- You want to find what's slow? Metric (to confirm there's something slow) → trace (to find which step).
- You want to debug a one-off issue? Log line + trace, pulled together by
trace_id. - You want to see a pattern across many requests? Aggregated logs (Loki LogQL, Elasticsearch) or a histogram of trace durations - both can work, depends on what you already have.
If you're reaching for logs to answer "how many?" questions, or for metrics to answer "what happened to this one request?" questions, you're using the wrong pillar. The good news is, once you've got OTel set up, you almost never have to think about it - you emit all three and the right one is there when you need it.
The flip side: setting all of this up is the unsexy part. There's no flashy demo for "I refactored my service so every span carries service.version from semconv". But the first time prod breaks at 3am and you go metric → trace → log in two minutes instead of forty, you'll be glad you did the boring work upfront.