You've got a Postgres database in production. It used to be fast. It's not fast anymore.
Maybe it's a single query that's gone from 20ms to two seconds. Maybe everything is a little slower and nobody can point at the exact moment it tipped. Maybe the database was fine yesterday and today the dashboards are red.
This is the part where you start opening tabs. Index advice, autovacuum docs, EXPLAIN ANALYZE, pgBouncer, somebody's blog post from 2018 that disagrees with somebody else's blog post from 2021. Three hours later you have forty browser tabs and no clear plan.
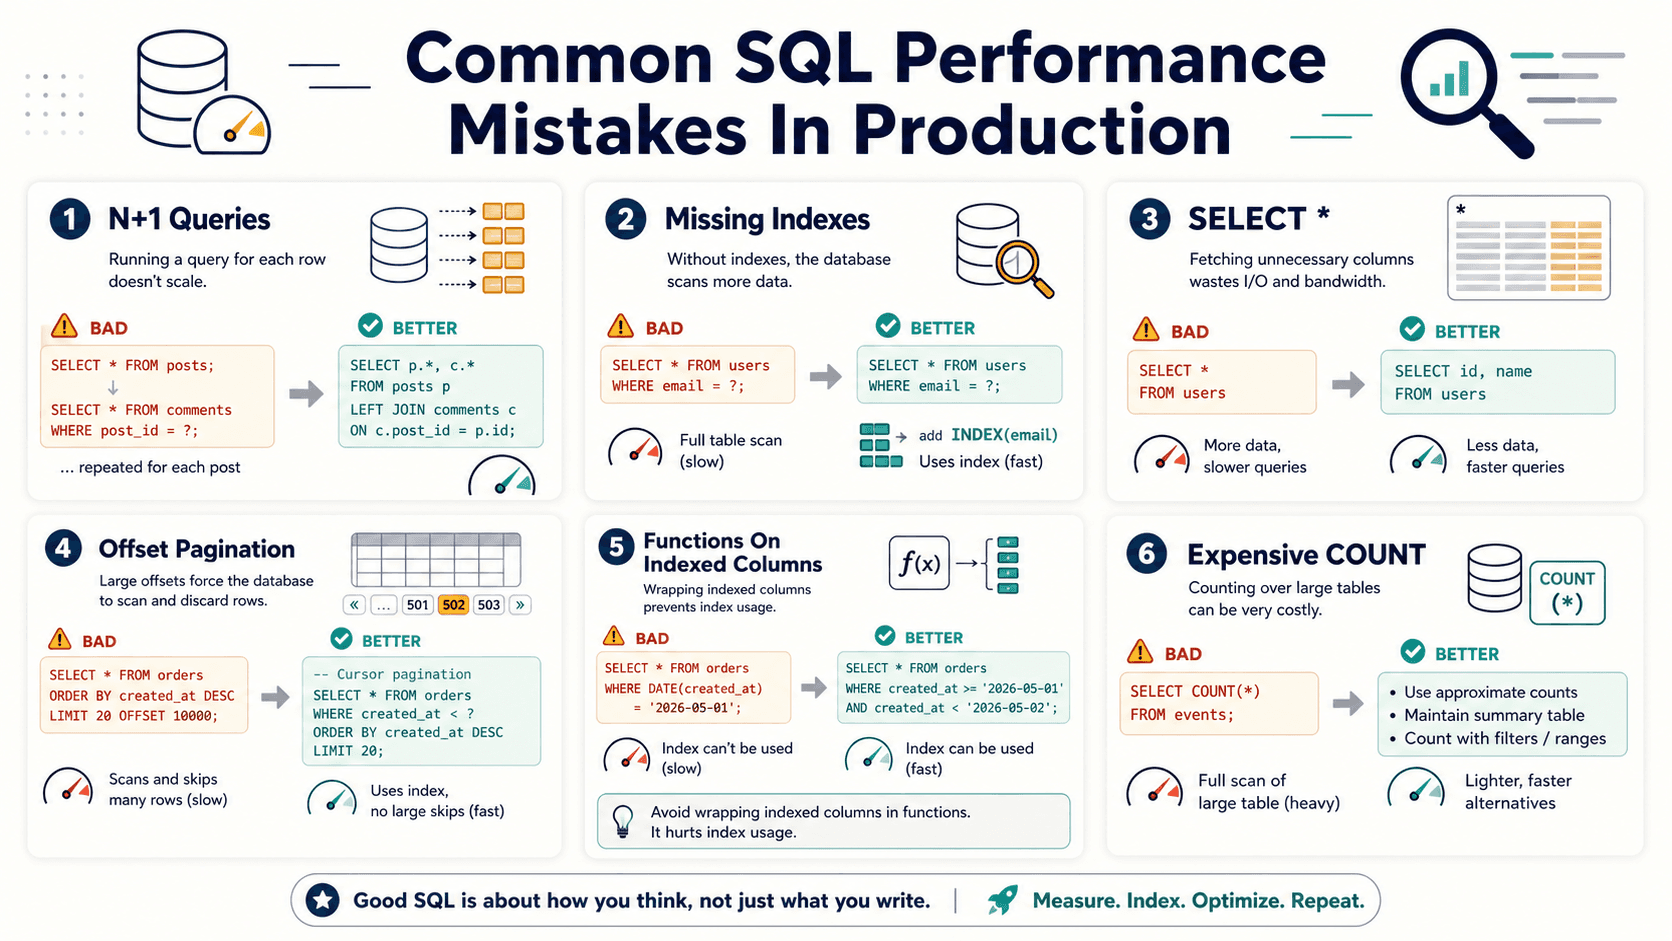
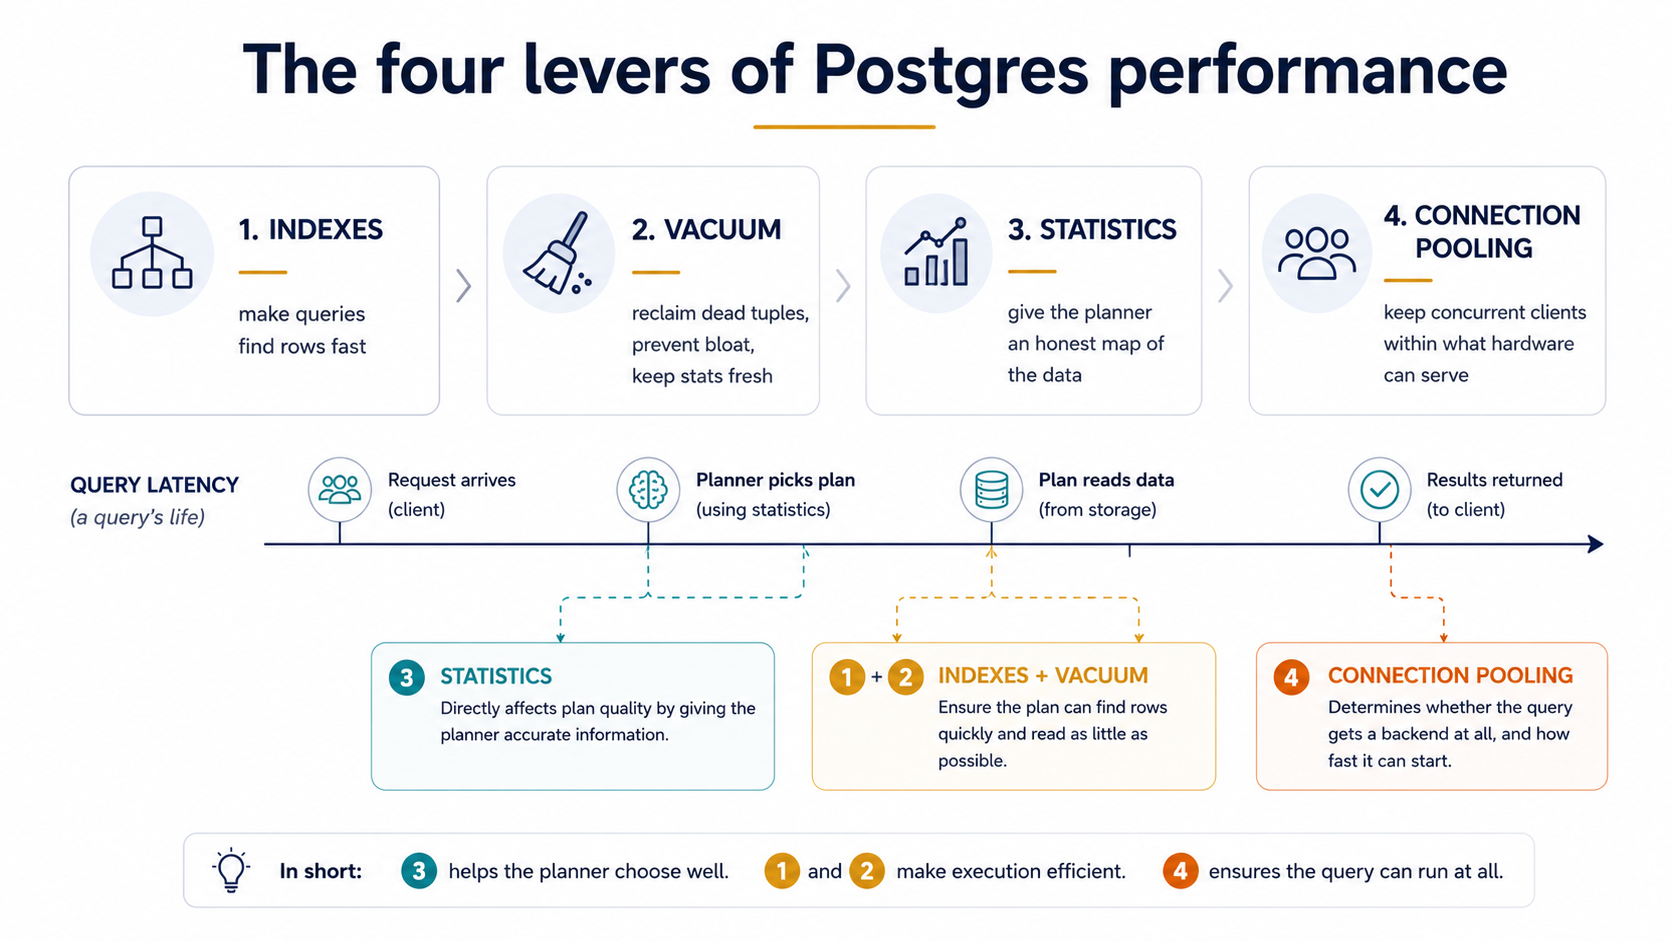
Postgres performance work is way less mystical than it looks. Almost every "the database is slow" incident I've watched a team work through ends up being one of four things - bad indexes, bloated tables and stale statistics from skipped vacuums, missing or misleading stats so the planner picks a dumb plan, or too many connections for the hardware. That's it. Four levers. Pull them in the right order, check the right thing on each one, and you fix most of the slowness most of the time.
This piece is the checklist I wish somebody had handed me on day one. It's not exhaustive - Postgres tuning has a long tail - but it covers the levers that pay rent. Each section tells you what the lever actually does, the handful of pg_stat_* queries that show whether it's working, and the common ways teams get it wrong.
Indexes: the lever everybody reaches for first
Indexes are the most-touched lever because they're the most visible one. A slow query, an EXPLAIN ANALYZE, an index, and the query is fast again. Easy win. Easy enough that teams over-rotate on it and forget the other three levers exist.
Still, indexes are where the checklist starts, because most of the time the first question is "is this query even using an index?" and the answer is "no, because there isn't one" or "no, because there is one but it's the wrong shape."
Check 1 - find the queries that actually need indexing
Don't index by guess. Index by data. Postgres ships with pg_stat_statements, which tracks every query executed and aggregates them by shape. Enable it (shared_preload_libraries = 'pg_stat_statements' plus CREATE EXTENSION pg_stat_statements;) and you can ask the database directly which queries are eating the most time.
SELECT
  substring(query, 1, 80) AS query,
  calls,
  total_exec_time::int AS total_ms,
  mean_exec_time::numeric(10,2) AS mean_ms,
  rows
FROM pg_stat_statements
ORDER BY total_exec_time DESC
LIMIT 10;
The rows at the top are where your time is going. A query that runs ten million times at 5ms each is a bigger problem than a query that runs once a day and takes a minute. Sort by total_exec_time, not mean_exec_time - that's where the leverage lives.
Check 2 - read the plan before adding the index
Take one of those top queries and run EXPLAIN (ANALYZE, BUFFERS) on it. You're looking for one of three patterns.
The first is a Seq Scan on a large table when you're filtering on a selective predicate. That's the textbook "missing index" smell. Add a B-tree on the column in the WHERE and re-run the plan; the Seq Scan should turn into an Index Scan and the row count read should drop by an order of magnitude.
The second is Index Scan but with a huge Rows Removed by Filter. That's a partial-coverage smell - the index helps with one column but the planner still has to re-check rows for the others. A composite index ((status, created_at) instead of just (status)) usually fixes it.
The third is Bitmap Heap Scan with a high Buffers: shared read. Reads are happening, but most of them aren't in cache. Sometimes that means the index is right but the working set is too cold; sometimes it means the index isn't selective enough to be worth using and a different one would do better.
EXPLAIN (ANALYZE, BUFFERS)
SELECT * FROM orders
WHERE customer_id = 42
  AND status = 'pending'
ORDER BY created_at DESC
LIMIT 20;
If the plan above scans the whole orders table, a composite index on (customer_id, status, created_at DESC) will turn it into a clean index-only walk that returns 20 rows.
Check 3 - find the indexes nobody is using
Indexes aren't free. Every write touches every index that covers a written column. Indexes that never get read on the hot path are pure write tax.
SELECT
  schemaname || '.' || relname AS table,
  indexrelname AS index,
  pg_size_pretty(pg_relation_size(indexrelid)) AS size,
  idx_scan AS scans
FROM pg_stat_user_indexes
JOIN pg_index USING (indexrelid)
WHERE idx_scan = 0
  AND NOT indisunique
  AND NOT indisprimary
ORDER BY pg_relation_size(indexrelid) DESC;
Two caveats before you drop anything. First, idx_scan resets when the stats are reset (or when you fail over to a replica that just got promoted) - make sure the counter has had at least a couple of weeks to accumulate. Second, some indexes exist for correctness, not speed; never drop a unique or primary-key index just because it's not in idx_scan.
For the rest, dropping unused indexes is one of the cheapest performance wins you'll ever do. The table writes get faster, the WAL gets smaller, replicas catch up faster, and you reclaim disk.
Check 4 - pick the right index type
B-tree is the default and the right answer 90% of the time. The other 10% is where teams trip:
jsonbcolumns queried with?,?|,?&, or@>want aGINindex, not a B-tree.- Full-text search with
to_tsvectorwantsGINon the tsvector column (or a generated column). - Geometric queries (
<->,@@) wantGiST. - Very large append-only tables where rows correlate with insertion order (logs, events, time-series) often do better with
BRINthan B-tree - much smaller index, slightly looser scans, but on a billion-row table the size difference is enormous. - Equality-only on a high-cardinality column where you never need range or sort:
hashis now crash-safe and can be a touch smaller than B-tree, though B-tree is rarely a wrong choice.
If you find yourself reaching for B-tree on a jsonb column, stop and look at what the query actually does. The query probably wants GIN, and the difference is two orders of magnitude.
Vacuum: the lever everybody forgets
Now we get to the lever that, in my experience, causes more "weird, slow, mysterious Postgres" than indexes ever do. Vacuum.
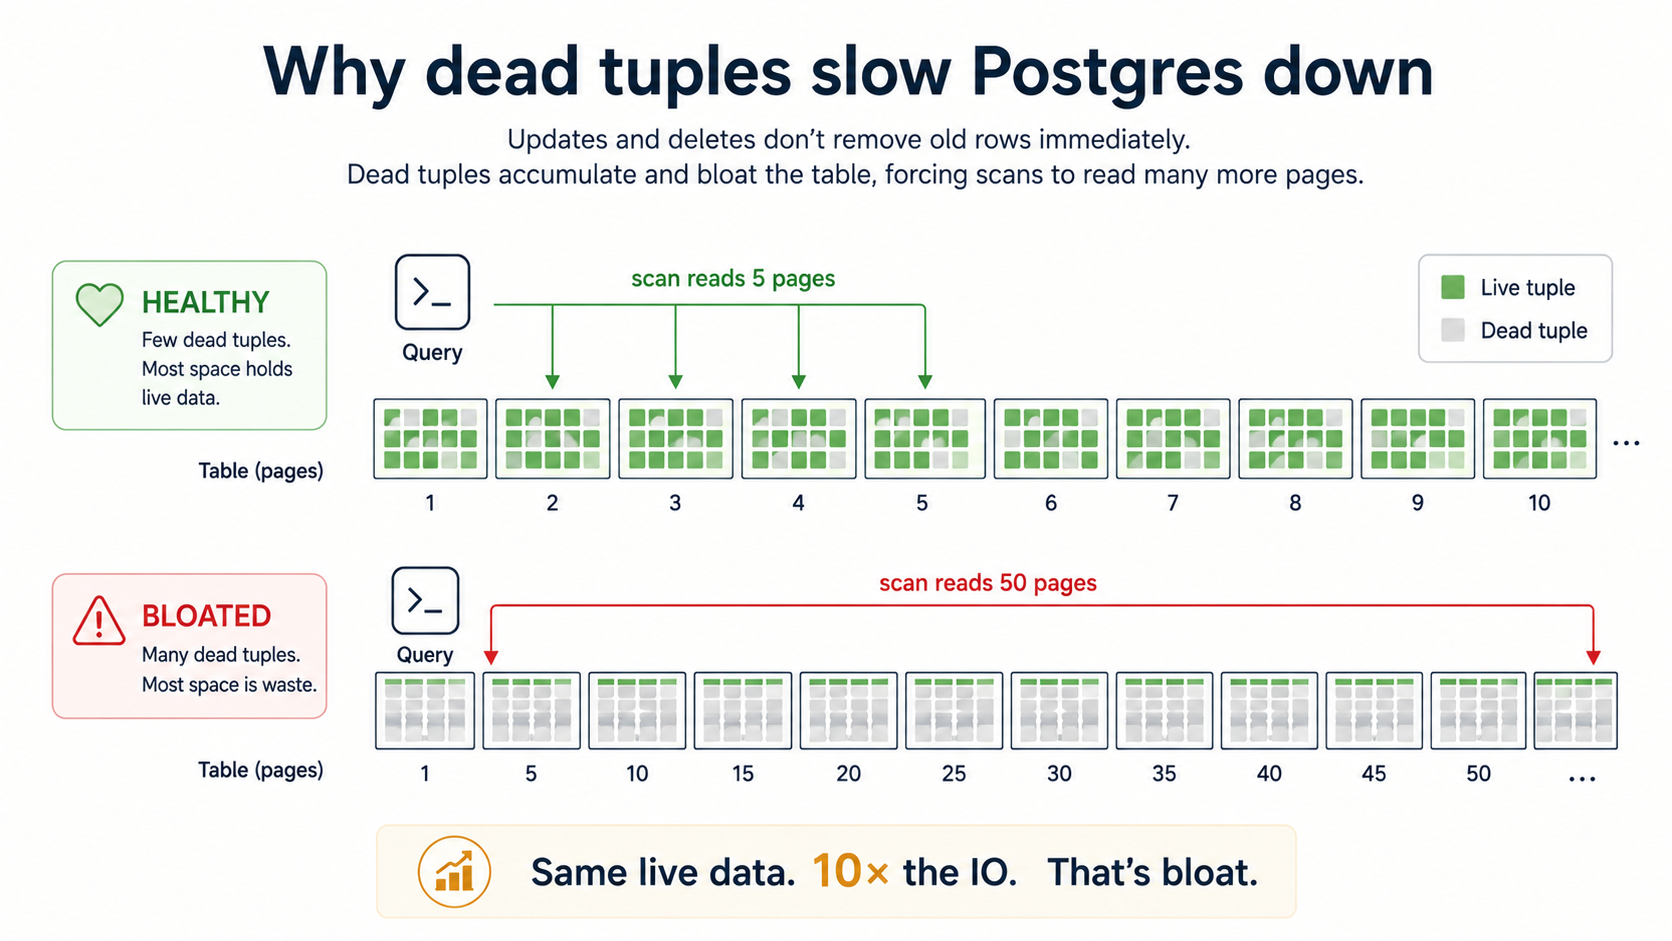
Postgres uses MVCC, which means an UPDATE doesn't overwrite a row - it writes a new version and marks the old one dead. A DELETE doesn't free space - it marks the row dead. Those dead rows still live in the table's pages until something cleans them up. That something is VACUUM.
When vacuum keeps up, dead rows are reclaimed quickly, the table stays compact, and queries read the same number of pages they always did. When vacuum falls behind, dead rows pile up - this is what "table bloat" means - and a sequential scan now reads pages full of garbage. The table on disk is 50GB but only 5GB of it is live data. Every query pays the bloat tax.
Check 1 - autovacuum is on, and is actually keeping up
Autovacuum is on by default. Don't turn it off. The number of times I've seen a team disable autovacuum to "stop it from interfering with the workload" only to come back six months later wondering why the database has gotten 20x slower is a number I've stopped counting.
But autovacuum being on isn't the same as autovacuum keeping up. Check whether it is:
SELECT
  schemaname || '.' || relname AS table,
  n_live_tup AS live,
  n_dead_tup AS dead,
  CASE WHEN n_live_tup > 0
       THEN round(100.0 * n_dead_tup / n_live_tup, 1)
       ELSE 0 END AS dead_pct,
  last_autovacuum,
  last_autoanalyze
FROM pg_stat_user_tables
ORDER BY n_dead_tup DESC
LIMIT 20;
A dead_pct over 20% on a hot table is a warning. Over 50% is a fire. last_autovacuum being NULL or weeks old on a table that gets writes means autovacuum isn't being triggered at all on it - usually because the per-table thresholds are too high.
Check 2 - tune autovacuum for hot tables
The default thresholds are tuned for the average table, which is often the wrong tuning for the table that takes 90% of your writes. Out of the box, autovacuum kicks in when dead_tuples >= 50 + 0.2 * live_tuples. On a 100-million-row table, that's 20 million dead rows before vacuum even starts. By the time it finishes, the table is bloated and the writes that were happening during the vacuum window have made things worse.
For tables you write to constantly, lower the per-table threshold:
ALTER TABLE orders SET (
  autovacuum_vacuum_scale_factor = 0.05,
  autovacuum_analyze_scale_factor = 0.02
);
That tells autovacuum to wake up at 5% dead-tuple ratio instead of 20%, and to run ANALYZE at 2%. It runs more often, each run does less work, and the table never gets a chance to bloat. The CPU cost is lower in aggregate than the cost of a single panicky vacuum freeze.
Check 3 - watch for transaction ID wraparound
This is the one that takes down databases at 3am. Postgres uses 32-bit transaction IDs, and they wrap. To prevent silent data loss, when a table's oldest unfrozen XID gets too old, autovacuum starts an aggressive VACUUM (FREEZE) that you can't easily kill, and if it can't keep up, the entire database eventually refuses writes until you run vacuum freeze in single-user mode. That's the kind of incident that ends with somebody on a call at 3am and a postmortem the next week.
You'll never get there if you watch this:
SELECT
  datname,
  age(datfrozenxid) AS xid_age,
  2147483647 - age(datfrozenxid) AS until_wraparound
FROM pg_database
ORDER BY age(datfrozenxid) DESC;
age(datfrozenxid) is how many transactions old the oldest unfrozen XID is, per database. The hard wraparound limit is 2.1 billion. The default warning threshold is 200 million, but you should be alerting at, say, 500 million. If you ever see a database approaching a billion, treat it as an outage in progress and run VACUUM FREEZE on the oldest tables now.
Check 4 - VACUUM FULL is not a normal operation
VACUUM reclaims space inside existing pages. VACUUM FULL rewrites the entire table into a fresh file and shrinks it on disk. It also takes an ACCESS EXCLUSIVE lock - no reads, no writes - for the duration. On a big table, that's not a tuning operation, that's planned downtime.
If you genuinely need to reclaim disk because a table got bloated and isn't getting written to anymore, prefer pg_repack or pg_squeeze (both extensions) which do the same job online with brief lock windows. VACUUM FULL should be a last resort, not a Tuesday-afternoon habit.
Statistics: the lever the planner needs to do its job
Postgres has a cost-based query planner. When you submit a query, the planner builds several candidate plans and picks the one with the lowest estimated cost. Estimated cost is built from statistics about your tables - how many rows, what the distribution of each column looks like, how correlated columns are with each other.
If those statistics are wrong, the cost estimate is wrong, and the planner picks a bad plan. You can have all the right indexes and the planner will still ignore them because it thinks a sequential scan is cheaper. Or it'll choose a nested loop join that would be perfect if there were 100 rows, but there are 100 million.
Bad statistics are the silent killer behind a lot of "but the index is right there!" incidents.
Check 1 - when did ANALYZE last run
Autovacuum runs ANALYZE automatically based on autovacuum_analyze_scale_factor - by default, after 10% of the rows have changed. That's fine for steady tables. For tables that change shape rapidly (a fact table with a new product launch, a queue table with a sudden traffic shape change, anything that just got a big bulk import), the planner is working off statistics that are now describing a different table.
After any bulk operation - a big COPY, a migration, a large UPDATE over many rows - run ANALYZE explicitly:
ANALYZE orders;
ANALYZE; -- everything, if you don't know what changed
This is cheap. It samples the table, updates pg_statistic, and is non-blocking. Run it more than you think you need to. It's the most under-appreciated performance tool in the database.
Check 2 - read estimated vs actual rows in EXPLAIN ANALYZE
Every node in an EXPLAIN ANALYZE plan shows two row counts:
Index Scan on orders  (cost=0.43..8.45 rows=1 width=24)
                      (actual time=0.013..0.014 rows=1247 loops=1)
rows=1 is the planner's estimate. rows=1247 is what actually came out. When the gap between estimated and actual is small, the planner has a good map of the data and the plan is probably close to optimal. When the gap is two or three orders of magnitude - rows=1 estimated, rows=10000 actual - the planner is flying blind. That's the smoking gun for stale or insufficient statistics.
The fix is usually one of three things: re-run ANALYZE, raise default_statistics_target for that column (more samples = better histograms), or - for correlated multi-column predicates the planner notoriously underestimates - create extended statistics:
CREATE STATISTICS orders_geo_corr (dependencies)
  ON country, region FROM orders;
ANALYZE orders;
Without that, the planner assumes column independence: "country='US' filters to 30%, region='West' filters to 25%, both = 7.5%." With it, the planner knows that nearly every region='West' row is also country='US', so the combined selectivity is closer to 25%. The estimate matches reality, and the plan picks the right join order.
Check 3 - default_statistics_target for skewed columns
Postgres collects 100 most-common-values and 100 histogram buckets per column by default. For a column with extreme skew - a tenant_id where one tenant is 70% of the rows and the rest are scattered - 100 buckets isn't enough to model the long tail.
-- Globally bumps the sample size to 500 for all future ANALYZE runs
ALTER SYSTEM SET default_statistics_target = 500;

-- Or per-column, which is usually what you want
ALTER TABLE events ALTER COLUMN tenant_id SET STATISTICS 1000;
ANALYZE events;
Don't crank this up everywhere. ANALYZE cost scales with the target, and the storage for pg_statistic grows. Bump it on the columns where you can prove the planner is misestimating, leave the rest at 100.
Connection pooling: the lever that becomes critical past a certain scale
Now the lever everybody hits exactly once and never wants to hit again. You've made every query fast. You've vacuumed. Your stats are dialled in. The database starts swapping or runs out of CPU under what should be a moderate load. The errors say FATAL: remaining connection slots are reserved.
Each Postgres connection is a separate OS process. That process has its own memory (usually a few megabytes minimum, often 10-30MB once you account for work_mem and caches), its own CPU context, its own scheduling cost. With 50 connections, all of that is fine. With 1000 idle connections - where 1000 application instances each hold a single open connection - you have 1000 OS processes contending for CPU and memory. The database isn't slow because the queries are slow. It's slow because the operating system is paging.
This is the connection pooling problem. The fix isn't more max_connections. The fix is fewer connections multiplexed across more clients.
Check 1 - what's the actual concurrent active query count?
Most apps that say they need 1000 connections actually run 30 active queries at a time. You can confirm this:
SELECT
  state,
  count(*) AS connections
FROM pg_stat_activity
GROUP BY state
ORDER BY connections DESC;
If idle is 800 and active is 30, you're keeping 800 connections open to do the work of 30. That's the slot a pooler fills.
Check 2 - pick the right pooler mode
PgBouncer is the standard answer. It runs in front of Postgres, accepts thousands of client connections, and fans them out onto a much smaller server-side pool. Three pooling modes, in increasing aggressiveness:
The first is session pooling - a client gets a server connection for the lifetime of the client's connection. Behaves identically to talking directly to Postgres. Useful if you can't afford to lose SET, LISTEN, prepared statements, or temp tables, but it doesn't actually reduce concurrency much.
The second is transaction pooling - a client gets a server connection only for the duration of one transaction, then the connection goes back into the pool. This is the mode most teams want. It cuts server connections by 10-50x without breaking most apps. Caveat: anything that depends on session state across transactions (server-side prepared statements, LISTEN/NOTIFY, advisory locks held outside a transaction, temp tables) doesn't work in this mode. Most ORM-driven apps are fine; some specialised setups aren't.
The third is statement pooling - a server connection is released after every statement. Brutal, breaks transactions, useful only for very specific read-only workloads. Almost never the right answer.
Check 3 - size the pool to the cores, not to the clients
The right number of server-side connections is roughly cpu_cores * 2 + storage_spindles, plus a small buffer. On modern SSD-backed Postgres, that's usually somewhere between 20 and 100. More connections than that and you're not adding throughput, you're just spending CPU on context switches.
[databases]
appdb = host=10.0.0.5 dbname=app

[pgbouncer]
pool_mode = transaction
max_client_conn = 2000
default_pool_size = 30
reserve_pool_size = 5
max_client_conn is how many app-side connections the pooler will accept; default_pool_size is how many it actually opens to Postgres per database/user combo. The ratio is the leverage you get.
Check 4 - application-side pool, too
The pooler in front of the database isn't the only pool that matters. Most application frameworks have their own internal connection pool (HikariCP in Java, pgbouncer plus pg-pool in Node, psycopg_pool in Python, ActiveRecord pool in Rails, and so on). When the app pool is smaller than the load it's serving, requests queue inside the app waiting for a connection - and that queueing time gets billed to the request, not to the database.
The rule of thumb is: app-side pool = the number of concurrent in-flight requests this app instance can do, sized to the throughput you actually need. Then put a pooler in front of the database, and the pooler's default_pool_size is what protects the database. The app pool protects the app from itself. The pooler protects the database from the app.
Putting the checklist together
You don't always need to run all four levers in the same incident. But you do need to know which lever you're pulling, and what to check before and after.
When somebody says "the database is slow", here's the order I usually go in:
First, look at pg_stat_statements and find the queries actually consuming time. If one query stands out, run EXPLAIN (ANALYZE, BUFFERS) on it. If the plan looks bad, ask whether it's a missing index, a stale-statistics misestimate, or both. Add the index, run ANALYZE, look at the plan again.
Second, check pg_stat_user_tables for dead-tuple ratios and last-autovacuum times on the hot tables. If anything is bloated, tune the per-table autovacuum thresholds and trigger a manual vacuum. Don't reach for VACUUM FULL.
Third, check pg_database for transaction-ID age. If anything is over a billion, drop everything else and run VACUUM FREEZE on the oldest tables.
Fourth, check pg_stat_activity for the ratio of idle to active connections. If most are idle, put PgBouncer in front of the database in transaction-pooling mode and size the server pool to a small multiple of the CPU count.
Most production Postgres slowness lives in one of those four checks. None of them require a deep dive into shared buffers, WAL tuning, or random_page_cost. Those things matter eventually, but the four levers above get you 80% of the way for 20% of the effort, and they keep you out of the 3am incidents.
The mental model worth keeping is that Postgres is rarely slow because of Postgres. It's slow because something stopped maintaining the conditions Postgres needs to be fast - an index that should exist doesn't, a vacuum that should have run didn't, a statistic that should have been refreshed wasn't, or a connection pool that should have existed isn't there. Build the habit of checking each of those, and "the database is slow" stops being a mystery.