Read this snippet for a second and tell yourself it does what it looks like it does.
import { Pool } from "pg";
const pool = new Pool();

await pool.query("BEGIN");
await pool.query("UPDATE accounts SET balance = balance - 100 WHERE id = 1");
await pool.query("UPDATE accounts SET balance = balance + 100 WHERE id = 2");
await pool.query("COMMIT");
It compiles. It might even pass the unit test that asserts both balances changed. And in production, on a busy Sunday, it will move $100 from one account into nowhere. There is no transaction here. Each pool.query quietly checks out whatever client the pool felt like handing you, runs one statement on it, and gives it back. The BEGIN ran on one connection, the first UPDATE on another, the COMMIT on a third. They aren't related to each other at all.
This is the kind of bug Postgres makes very easy to write from Node.js, because the API surface is friendly enough that the wrong code looks right. Most of the performance tips in this article are like that, the working code and the dangerous code look almost identical, and the difference is one line, one option, one keyword. Once you know what to look for, your Postgres becomes a different database. Faster, calmer, and a lot harder to set on fire.
Let's go through it.
The Pool Is Not Free, And The Defaults Are Conservative On Purpose
Almost everyone reaches for new Pool() from pg and never opens the second page of the docs. That's fine for a tutorial. It is not fine for production.
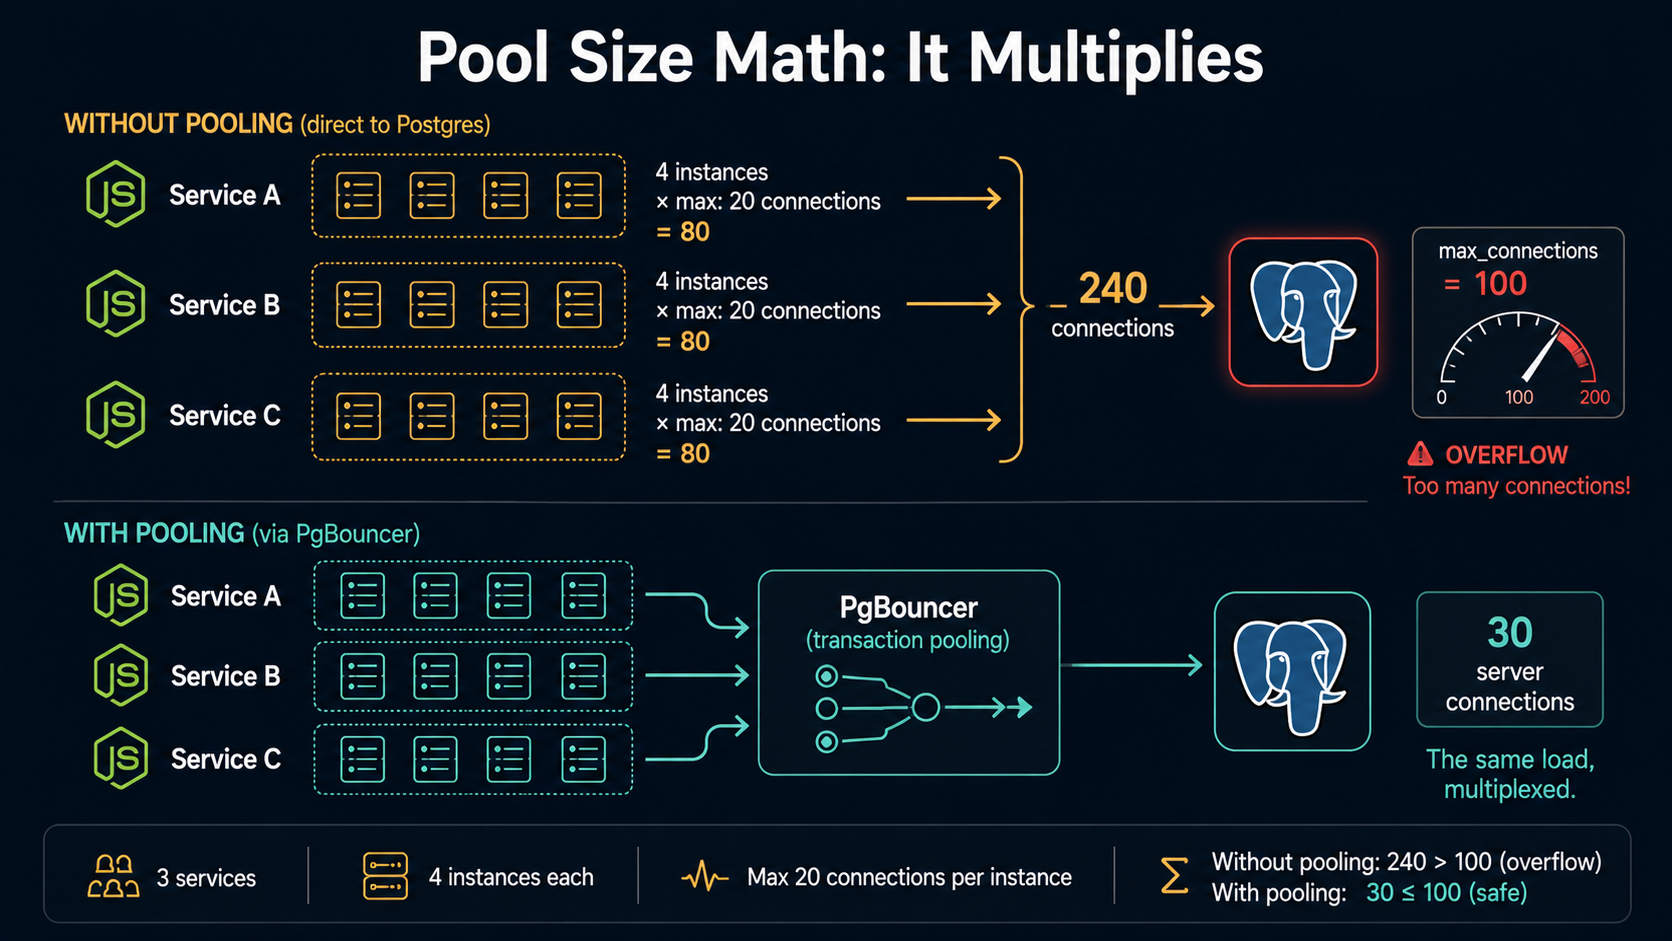
A few things to know up front. The default max for pg.Pool is 10. That's per process. If you're running four Node instances behind a load balancer, you've already promised your database up to forty active connections from this one service. If you have ten services like that, your single Postgres box is sitting on a 400-connection ceiling, and Postgres itself defaults to max_connections = 100. The math doesn't even work out on a small fleet.
The classic sizing formula for an OLTP Postgres workload is (cores * 2) + 1 on the database server, total, across all clients. That's not a rule, it's a starting point, the right number depends on whether your queries are I/O-bound, CPU-bound, or just sitting on the network. But it's a much better starting point than "everyone pick 50 and hope".
Here's the configuration that you should actually be writing:
import { Pool } from "pg";

export const pool = new Pool({
  // Sized to your service, not to your laptop.
  max: Number(process.env.PG_POOL_MAX ?? 10),

  // Don't leave dead-but-checked-out clients lying around forever.
  idleTimeoutMillis: 30_000,

  // Fail fast when the database is unreachable instead of hanging requests.
  connectionTimeoutMillis: 5_000,

  // Recycle a client after N uses. Postgres backends can slowly drift in
  // memory over thousands of statements; this keeps things tidy.
  maxUses: 7_500,
});

pool.on("error", (err) => {
  // Don't crash the process on idle-client errors — log and move on.
  console.error("pg pool error", err);
});
The maxUses knob is the one nobody finds on their own. A Postgres backend process is a real OS process whose memory grows with the catalog and plan caches it accumulates. Recycling the connection every few thousand statements drops that cost back to zero. The exact number isn't sacred, pick something in the thousands and move on.
And the pool.on("error", ...) line is not optional. Without it, an idle client that gets killed by the database (network blip, server-side idle_in_transaction_session_timeout, anything) emits an error event with no listener, which Node treats as an uncaught exception. Your service crashes for a reason that has nothing to do with what your service was actually trying to do.
If you're behind a connection pooler like PgBouncer (we'll come back to it later), your per-service pool can be much smaller, sometimes five connections is plenty, because the pooler is doing the real multiplexing in front of the database. The mental model is "the pool sized to a single Node process times the number of processes is what the pooler sees; the pooler then talks to Postgres with a much smaller number of long-lived backend connections."
The point is: pick a size on purpose. Write down the math. Don't ship new Pool() to production.
Always Parameterize. Sometimes Prepare. Never Concatenate.
There is one rule from which everything else flows: never build SQL by interpolating user input. $1, $2, $3 are how you talk to Postgres safely. Yes, you know this. But the same rule is also how you talk to Postgres fast, and that part is less obvious.
// Wrong, dangerous, and slower than the right answer.
await client.query(
  `SELECT * FROM users WHERE email = '${req.body.email}'`,
);

// Right. Safer. And the planner can actually do its job.
await client.query(
  "SELECT * FROM users WHERE email = $1",
  [req.body.email],
);
The reason the second form is faster has nothing to do with the parser, both versions get parsed every time. It's that with parameterized queries, Postgres knows what the query shape is independent of the literal values, which lets it cache plans more aggressively and (more importantly) lets you bolt on the next optimization.
That next optimization is named prepared statements. The pg driver supports them with a single extra field:
const result = await client.query({
  name: "find-user-by-email",
  text: "SELECT id, name FROM users WHERE email = $1",
  values: [req.body.email],
});
The first time pg runs this on a given connection, it sends a PARSE with the name, then BIND and EXECUTE. The plan gets cached on the server, on that specific connection, under that specific name. Every subsequent call on the same connection skips the PARSE and goes straight to BIND/EXECUTE. For complex queries with joins, subqueries, or expensive planning, this can shave a meaningful chunk off your latency, published benchmarks tend to land in the 20-30% range for repeated complex queries.
Two important caveats people miss:
- The cache is per connection, not per pool. If your pool has
max: 20, you'll pay thePARSEcost twenty times, once on each connection the first time it sees this named statement. For a heavily-hit query that's fine. For a query that runs three times a week, the bookkeeping isn't worth it. - Prepared statements can be slower than unprepared ones for trivial queries. A
SELECT * FROM small_table WHERE id = $1has nothing to plan. The wire overhead of the extraPARSEround trip can wipe out the savings, and on bulk inserts it can show as a measurable regression. The rule of thumb: prepare statements that are repeated, complex, or both. Don't blanket-name every query.
If you're using pg-promise instead of raw pg, the syntax is different but the model is the same, new PreparedStatement(...) gives you the named-statement behavior with a slightly more ergonomic API around it.
Transactions Belong To A Client, Not To The Pool
Back to the broken snippet from the top. Here is what that code was trying to be:
export async function transfer(fromId: number, toId: number, amount: number) {
  const client = await pool.connect();
  try {
    await client.query("BEGIN");
    await client.query(
      "UPDATE accounts SET balance = balance - $1 WHERE id = $2",
      [amount, fromId],
    );
    await client.query(
      "UPDATE accounts SET balance = balance + $1 WHERE id = $2",
      [amount, toId],
    );
    await client.query("COMMIT");
  } catch (err) {
    await client.query("ROLLBACK");
    throw err;
  } finally {
    client.release();
  }
}
The key word is client. pool.connect() checks out one specific connection and gives it to you. All your transaction statements have to run on that client. The try / catch / finally shape is non-negotiable: the BEGIN and COMMIT must run on the same connection, the ROLLBACK runs on error, and the finally releases the client back to the pool no matter what. Skip the release() and that connection is gone forever, your pool slowly bleeds capacity until it deadlocks.
There's a subtle race condition worth knowing about. If your code path can throw between BEGIN and ROLLBACK, you have to be sure your error handler isn't itself awaiting something that depends on the pool. There is a known class of bugs where, under load, the pool removes an idle client mid-rollback and your ROLLBACK throws Client was closed and is not queryable. The defensive shape is to nest the try/catches so that the outer one wraps connect itself, the inner one wraps the actual queries, and the finally is the only place release lives.
async function withTransaction<T>(fn: (c: PoolClient) => Promise<T>): Promise<T> {
  const client = await pool.connect();
  try {
    try {
      await client.query("BEGIN");
      const result = await fn(client);
      await client.query("COMMIT");
      return result;
    } catch (err) {
      // Best-effort rollback. If the client is already gone, swallow it —
      // throwing here would mask the real error from `fn`.
      await client.query("ROLLBACK").catch(() => {});
      throw err;
    }
  } finally {
    client.release();
  }
}
Wrap this once. Use it everywhere. Most of the "weird Postgres locking" bugs people hit in Node are actually just one of:
- Someone called
pool.queryinside a function that thought it was in a transaction. - Someone forgot to release.
- Someone called an external API (Stripe, SendGrid, anything) between
BEGINandCOMMIT.
That third one deserves its own section.
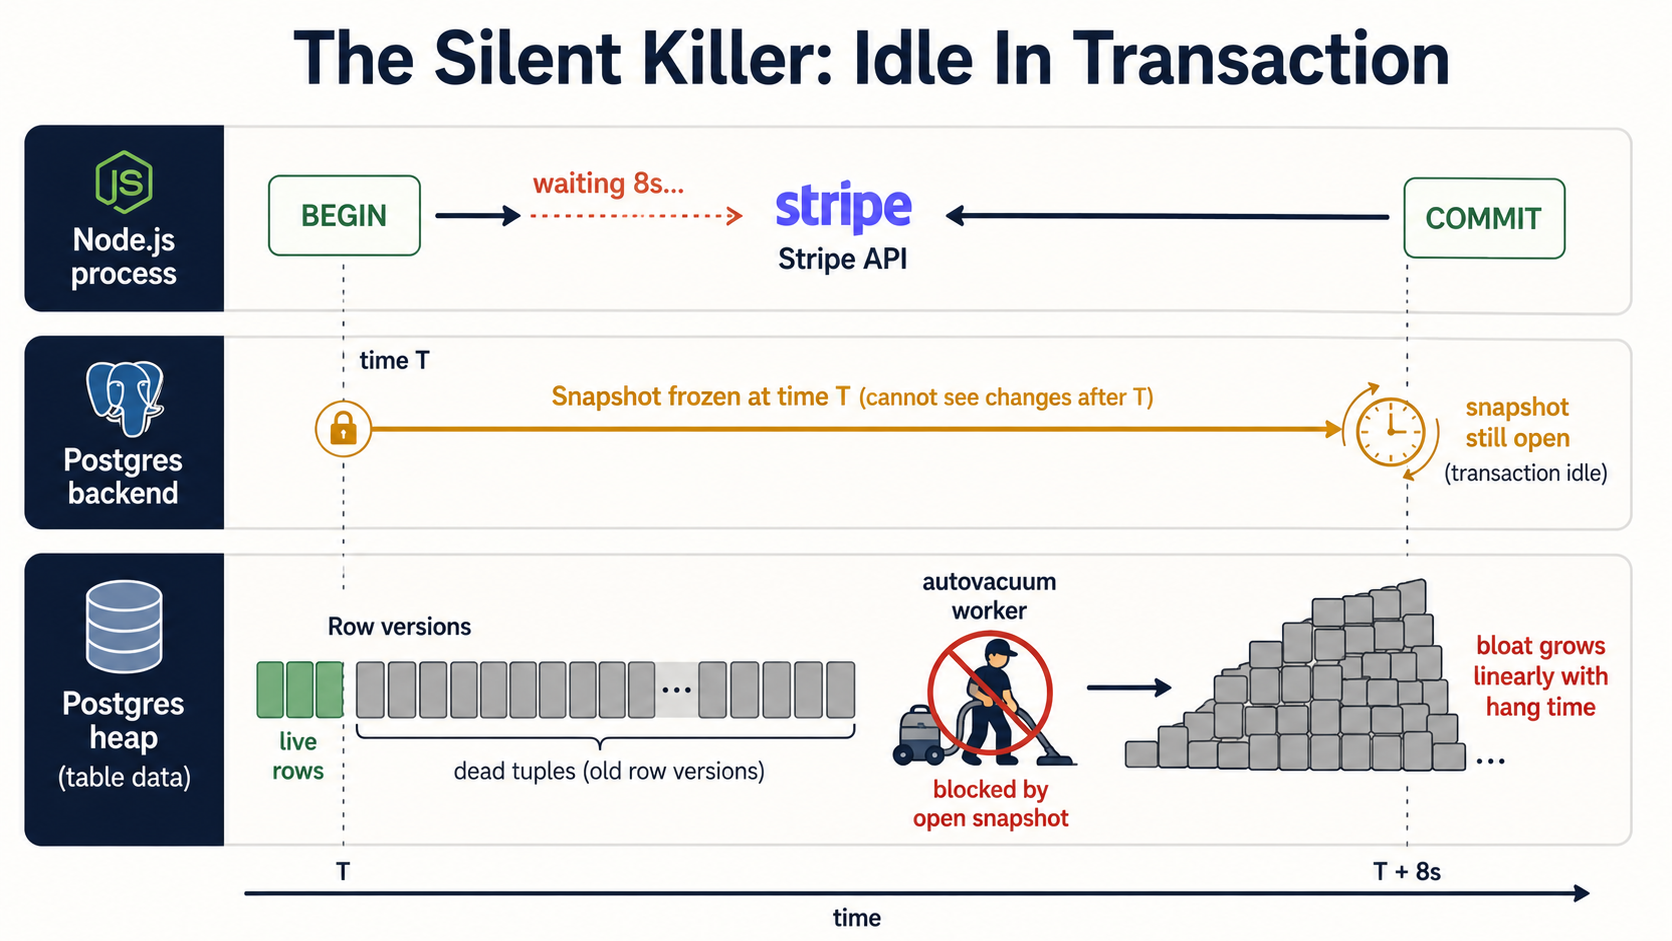
Don't Hold A Transaction Open While You Wait For The Internet
Inside a transaction, your connection is holding a snapshot of the database. As long as that transaction is open, Postgres can't reclaim the row versions your snapshot can still "see", because, from your perspective, they're still part of the world. That sounds fine, until somebody writes this:
await withTransaction(async (client) => {
  const order = await createOrder(client, payload);
  // 👇 The bug.
  const charge = await stripe.charges.create({ amount: order.total });
  await markOrderPaid(client, order.id, charge.id);
});
Stripe takes a few hundred milliseconds on a good day, several seconds on a bad day, and once in a while it hangs until your HTTP timeout kicks in. While you're waiting, that database connection is "idle in transaction", the connection is alive, but it's not doing anything except holding its snapshot open.
Why this is a real problem: idle-in-transaction sessions block autovacuum. Postgres can't remove dead row versions newer than the oldest open snapshot, which means a single transaction that hangs around long enough is enough to stop the cleanup of an entire heap. There are documented incidents of a single forgotten transaction turning a 1 GB table into a 50 GB one, same rows, just an enormous tail of dead tuples that vacuum couldn't touch.
Two server-side knobs limit the damage:
-- In postgresql.conf, or per-session SET.
SET statement_timeout = '30s';
SET idle_in_transaction_session_timeout = '60s';
statement_timeout aborts any single statement that runs longer than the limit. idle_in_transaction_session_timeout terminates a session that has been idle inside an open transaction for too long. Both of those values should be set, both in your postgresql.conf and explicitly on the connections your service makes, so a misbehaving deploy can't drag the whole cluster down.
And on the application side, the rule is simple: the only thing inside a transaction is the database work. External calls, slow CPU-bound work, anything that can stall, pull it out. Either do it before, do it after, or build a saga pattern. Don't hold a Postgres transaction open while you wait for somebody else's API.
A handy diagnostic query, for when you want to know if this is biting you right now:
SELECT pid,
       usename,
       application_name,
       state,
       now() - state_change AS time_in_state,
       query
FROM pg_stat_activity
WHERE state = 'idle in transaction'
ORDER BY time_in_state DESC;
If you see entries older than a few seconds, you have a leak somewhere in your code. Time to follow application_name back to the service.
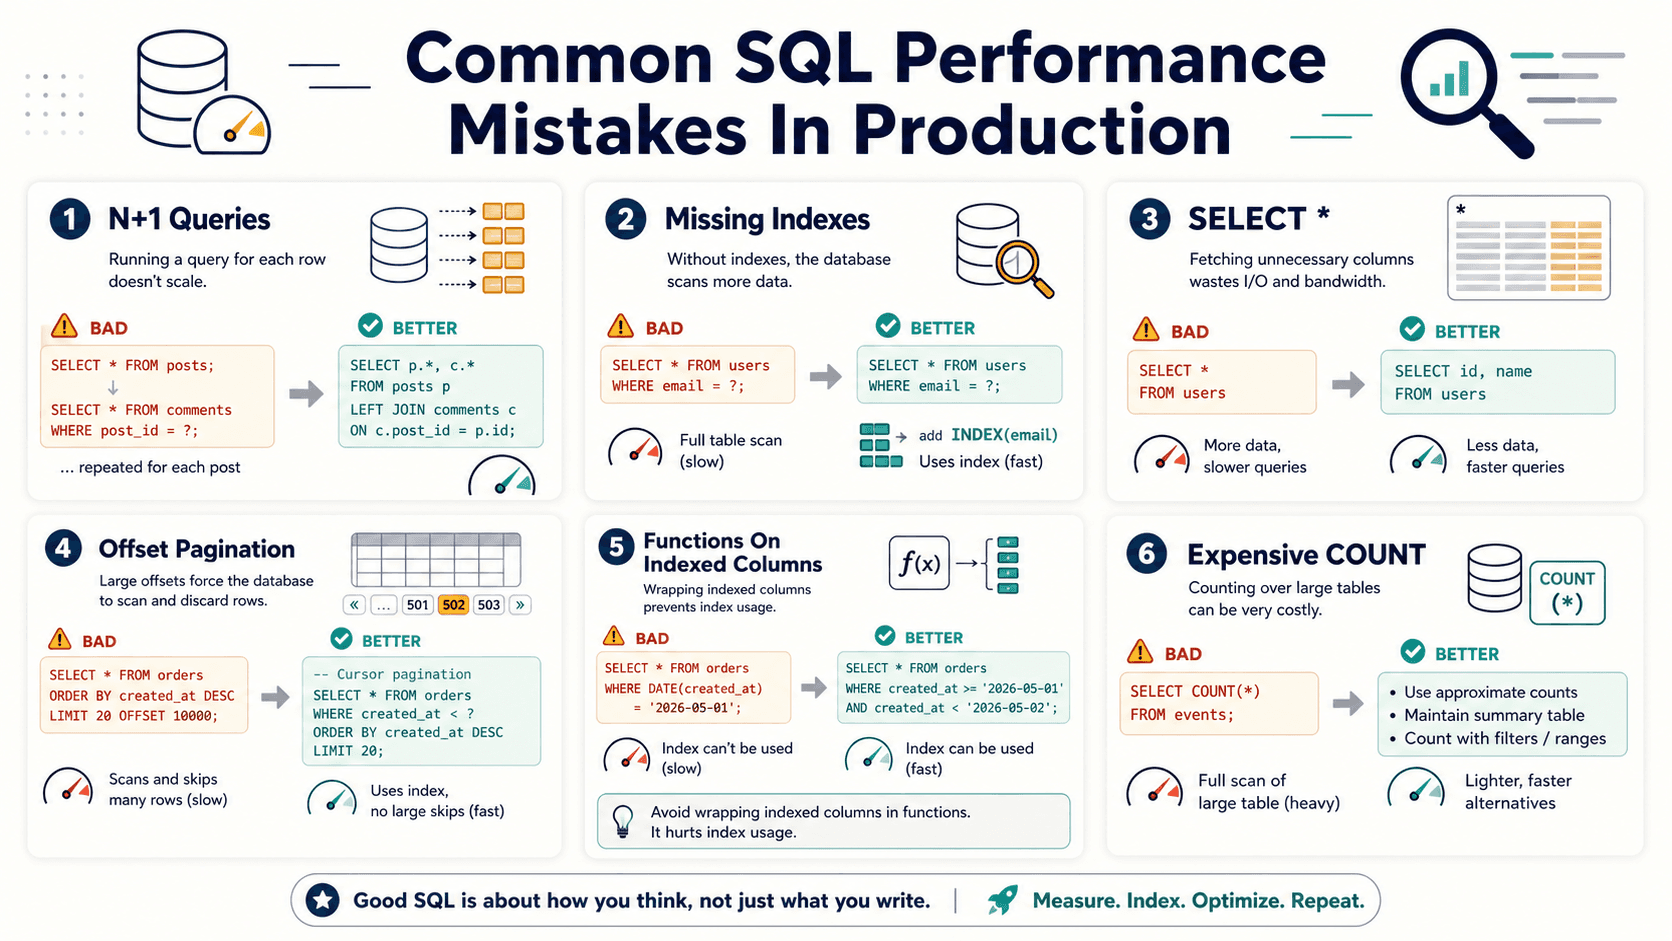
Indexes That Earn Their Keep, Not Indexes That Just Exist
Indexes are the first thing every Postgres tutorial talks about and the last thing most apps actually tune well. A few hard rules from production experience.
B-tree is almost always the right answer. It supports equality, range, ordering, partial matching with anchored prefixes, and works with the entire planner machinery. Hash indexes only handle equality. The case for using a hash index instead of a B-tree, in 2026, is "you've already benchmarked your specific workload and proven B-tree is the bottleneck." If you haven't, use B-tree.
Add indexes to support actual query shapes. The shape of an index isn't "the column you filter on", it's the full prefix of the columns in the order they appear in your WHERE, JOIN, and ORDER BY. An index on (user_id, created_at DESC) is fantastic for WHERE user_id = $1 ORDER BY created_at DESC LIMIT 20. It's worthless for WHERE created_at > $1. Same columns, different order, completely different lookup behavior.
Partial indexes are underused. They're an index built only over the rows that match a predicate. If 95% of your tasks table is status = 'done' and you only ever query status IN ('pending', 'running'), indexing all of done is wasted space and wasted maintenance work on every insert and update. A partial index makes both the index and the maintenance cheaper:
CREATE INDEX tasks_pending_running_idx
  ON tasks (assignee_id, created_at)
  WHERE status IN ('pending', 'running');
Now the index is the size of your hot subset, not the whole table, and only the rows you care about end up in it.
Covering indexes give you index-only scans, but they tax writes. Adding INCLUDE (col_a, col_b) to an index puts those columns inside the index leaves without making them part of the search key. If your query only reads those columns, Postgres can answer it from the index alone, no heap fetch. That's an enormous win for read-heavy queries on narrow projections. The cost is that every UPDATE to those included columns has to update the index too, even though the search key didn't change. On write-heavy tables, covering indexes can quietly turn cheap updates into expensive ones.
-- Read-heavy dashboard query? Covering index pays for itself.
CREATE INDEX orders_customer_status_covering_idx
  ON orders (customer_id, status)
  INCLUDE (total_cents, currency);
Don't add indexes you can't justify. Every index is paid for on every write, in lock contention, in WAL volume, in disk space, and in plan-cache pressure. The right answer to "should we add this index?" starts with running the query, looking at the plan, and confirming there's actually a sequential scan worth replacing.
Which gets us to the next thing.
EXPLAIN (ANALYZE, BUFFERS) Is Your Microscope
If you take one habit from this article, take this one: never tune a slow query without EXPLAIN (ANALYZE, BUFFERS) open in front of you.
EXPLAIN shows the planner's plan. ANALYZE actually runs the query and reports real timings and row counts. BUFFERS tells you how much data was read from the shared cache versus from disk. That last part is the one most people don't add, and it's the one that usually contains the actual story.
EXPLAIN (ANALYZE, BUFFERS, FORMAT TEXT)
SELECT o.id, o.total_cents, c.name
FROM orders o
JOIN customers c ON c.id = o.customer_id
WHERE o.status = 'pending'
ORDER BY o.created_at DESC
LIMIT 100;
A typical output line looks like:
Index Scan using orders_status_created_at_idx on orders o
  (cost=0.42..123.84 rows=100 width=24) (actual time=0.018..1.214 rows=100 loops=1)
  Buffers: shared hit=143 read=12
The two numbers to read first are:
shared hit, how many 8 kB blocks were already in Postgres's shared buffers (i.e., in RAM, free to read).shared read, how many blocks had to come off disk (or out of the OS page cache).
A query that does shared hit=10000 read=0 is fast and cached. A query that does shared hit=100 read=10000 is fast right now because the disk was sympathetic, and will be slow as soon as a different workload pushes its pages out of cache. The actual time numbers can lie to you when the cache is warm; the Buffers numbers don't.
Postgres 18 made this easier, EXPLAIN ANALYZE now includes buffer counts automatically, without needing BUFFERS separately. If you're on an older version, get used to typing the option every time.
Pair this with track_io_timing = on in your postgresql.conf (or via ALTER SYSTEM), and the plan output will also tell you how much wall-clock time was spent on I/O specifically. When you're trying to figure out whether your problem is "Postgres is slow" or "the disk is slow", that distinction matters.
The most common things to look for in a plan:
Seq Scanon a large table when you expected anIndex Scan. Either the index is missing, or the planner thinks it's cheaper to scan the whole table (which is sometimes correct, and sometimes a stats problem you fix withANALYZE table_name).Rowsestimate massively wrong, the line saysrows=10andactual time=... rows=1000000. The planner is operating on bad statistics; that's usually fixable withANALYZE, sometimes with extended statistics (CREATE STATISTICS).Sortwith aSort Method: external merge, your query spilled to disk becausework_memis too small for it. Either raisework_mem(per-session, for that query), or add an index that returns rows already sorted.- A
Nested Loopagainst a large outer side. Sometimes the right answer; often a sign the planner picked the wrong join strategy because of bad row estimates upstream.
You don't have to be a planner expert. You have to be willing to read the output and ask "what is this number bigger than I expected?" Most query-tuning work is exactly that loop.
Stream Big Result Sets. Don't Slurp Them.
A pattern I see constantly in Node services: somebody needs to export a million rows, so they write client.query("SELECT * FROM events WHERE ..."), get a single array of a million objects back, and watch their service die from memory pressure.
pg has a separate module for this. Two, actually.
pg-cursor lets you explicitly page through a result set on the server:
import Cursor from "pg-cursor";

const client = await pool.connect();
try {
  const cursor = client.query(new Cursor("SELECT * FROM events WHERE ..."));
  while (true) {
    const rows = await new Promise<any[]>((resolve, reject) =>
      cursor.read(500, (err, rows) => (err ? reject(err) : resolve(rows))),
    );
    if (rows.length === 0) break;
    for (const row of rows) await handle(row);
  }
} finally {
  client.release();
}
pg-query-stream wraps a cursor in a Node Readable, which composes nicely with everything else in the streams ecosystem:
import QueryStream from "pg-query-stream";
import { pipeline } from "node:stream/promises";

const client = await pool.connect();
try {
  const stream = client.query(
    new QueryStream("SELECT * FROM events WHERE ...", [], { batchSize: 500 }),
  );
  await pipeline(stream, transformToCsv(), res); // res is an Express Response
} finally {
  client.release();
}
Two things to internalize:
- The cursor lives on a single client. You can't stream over
pool.queryfor the same reason you can't transact over it. Acquire a client, do your streaming work, release. - The batch size matters. Too small and you're paying network round-trip latency on every batch. Too large and you've reinvented the original "load everything into memory" problem in slow motion. A few hundred to a few thousand rows is usually right; benchmark for your row width.
The other anti-pattern in the same family is N+1 queries. The version of this that hides best in a Node codebase is something like:
const users = await db.query("SELECT id, name FROM users LIMIT 100");
for (const u of users.rows) {
  const orders = await db.query(
    "SELECT * FROM orders WHERE user_id = $1",
    [u.id],
  );
  u.orders = orders.rows;
}
That's 101 round trips to Postgres for what should be one query with a JOIN, or one IN (...) query and an in-memory grouping. The fix is almost always shape-of-the-query, not amount-of-Node-code. If you're using an ORM that gives you eager loading (include in Prisma, with in Drizzle, etc.), use it. If you're hand-writing SQL, do the join yourself.
PgBouncer Is Not Transparent: Especially With Prepared Statements
Once your service starts scaling sideways, you'll either be told to put PgBouncer (or a similar pooler) in front of Postgres, or you'll figure out the hard way that you need to. The reason is the math from earlier: per-process pools multiply, Postgres connections are expensive, and at some point you need somebody to multiplex many short-lived "I want to run one statement" requests over a much smaller set of long-lived backend connections.
PgBouncer has three pooling modes:
- Session pooling, a client holds a server connection for the duration of its session. Behaves like having no pooler at all, in terms of features. Fewest gotchas. Least multiplexing benefit.
- Transaction pooling, a server connection is assigned to a client for the duration of a single transaction. Highest multiplexing benefit, and the mode you actually want at scale.
- Statement pooling, server connection assigned per statement. Multi-statement transactions don't even work. Niche.
The trap is that transaction mode used to be silently incompatible with named prepared statements. If your pg code was using name: "find-user-by-email" and you stuck PgBouncer in transaction mode in front of it, the second invocation on a different backend connection would fail because the server hadn't seen that prepared name.
This got fixed in PgBouncer 1.21, which added protocol-level prepared statement support in transaction mode. To turn it on you need to set max_prepared_statements to a non-zero value (it defaults to 0, meaning "off") in PgBouncer's config:
pool_mode = transaction
max_prepared_statements = 200
With that set, PgBouncer keeps an LRU cache of prepared statements per server connection and transparently re-prepares them on whichever backend it hands a client next. Your Node service can keep using the extended query protocol with names, and the pooler does the right thing behind the scenes.
If you're on an older PgBouncer, or for some reason max_prepared_statements isn't an option, the safe shape from Node is: don't use named prepared statements. Use plain parameterized queries, they still go through BIND/EXECUTE under the hood, they're still safe, you just don't get the planner-cache reuse you'd get on a direct connection.
The other operational gotcha with PgBouncer: session-state things stop working across statements. Temp tables, server-side cursors (yes, including the ones from pg-cursor and pg-query-stream), LISTEN/NOTIFY, prepared statements without max_prepared_statements, all of those rely on a specific backend connection, and transaction-mode pooling will hand you a different one between calls. If your code needs any of those features, that code path has to acquire a client, do all the related work inside one transaction (or in session mode), and release.
A Few Smaller Things That Add Up
Not every fix is a section of its own. A handful of cheap habits:
- Set
application_nameon every connection. It's a single line in the pool config (application_name: "checkout-api"), and it makespg_stat_activityactually useful. When you're staring at a hundred connections trying to figure out which service is the culprit, named connections save the day. - Use
RETURNINGinstead of a follow-upSELECT. Postgres letsINSERT,UPDATE, andDELETEreturn columns.INSERT INTO orders (...) VALUES (...) RETURNING id, created_atis one round trip; the equivalent insert-then-select is two. - Batch your inserts.
INSERT INTO events (a, b, c) VALUES ($1,$2,$3), ($4,$5,$6), ($7,$8,$9)is one statement and one plan; the loop version is N statements and N round trips. For bulk loads, look atCOPY, it's an order of magnitude faster than individual inserts. - Pin your client encoding and timezone explicitly. Letting the server defaults leak in is a great way to spend an afternoon debugging why a timestamp is six hours off in staging only.
- Don't
SELECT *from a table with a wide row. Postgres reads the whole row off the heap whether you asked for one column or twenty. The wire and JSON-serialization cost of the unused columns is real. - Index foreign keys. Postgres does not auto-index the referencing side of a foreign key. If you've ever done
DELETE FROM users WHERE id = $1on a table referenced by ten others, all of which seq-scanned to find the matching rows, you know.
None of these are dramatic. All of them are free. Apply enough of them and your p99 latency starts looking a lot friendlier.
The Mindset, Not The Checklist
The things in this article aren't a template you check off. They're a way of thinking. The database is a real system with real costs, connections are expensive, snapshots have consequences, plans get cached, disks have to fetch real bytes. Most "Postgres is slow" stories are really "the application is asking Postgres to do something it shouldn't have to."
The good news is that, almost without exception, the fix is shape, the shape of the pool, the shape of the query, the shape of the transaction, the shape of the index. Once the shape is right, the database is patient. It does not complain. It just keeps working.
The other piece of good news is that Postgres tells you exactly what it's doing the moment you ask. pg_stat_activity shows you the live state. EXPLAIN (ANALYZE, BUFFERS) shows you the plan and the cost. pg_stat_statements shows you the historical pain points. The information is there. The only thing standing between you and a fast Node-on-Postgres service is the habit of looking.
Go look.