You've read the canonical event-loop diagram. It has six boxes and an arrow that loops back. It is not wrong, but it does not stick — because nothing in it looks like the code you actually ship.
So let's flip it. Instead of starting with phases, start with one sluggish endpoint, watch how it breaks the loop, and reverse-engineer the model from there. By the end you'll be able to look at a handler and predict, roughly, when each line will actually run.
Why "It's Just Async" Is Not An Answer
Here's a handler that looks fine in code review:
app.get('/health', (req, res) => {
  res.json({ ok: true, ts: Date.now() });
});

app.post('/import', async (req, res) => {
  const csv = await readFile('./report.csv', 'utf8');
  const rows = csv.split('\n').map(parseRow); // 200k rows
  await db.insertMany(rows);
  res.json({ inserted: rows.length });
});
/health returns in microseconds — until someone hits /import. While csv.split(...).map(...) is running, the loop is blocked. /health queues. So does every other request, every timer, every microtask. The handler is async, but the slow part is synchronous CPU work, and async doesn't help with that.
This is the whole event-loop problem in one example: Node can do many slow things at once, but only one fast thing at a time.
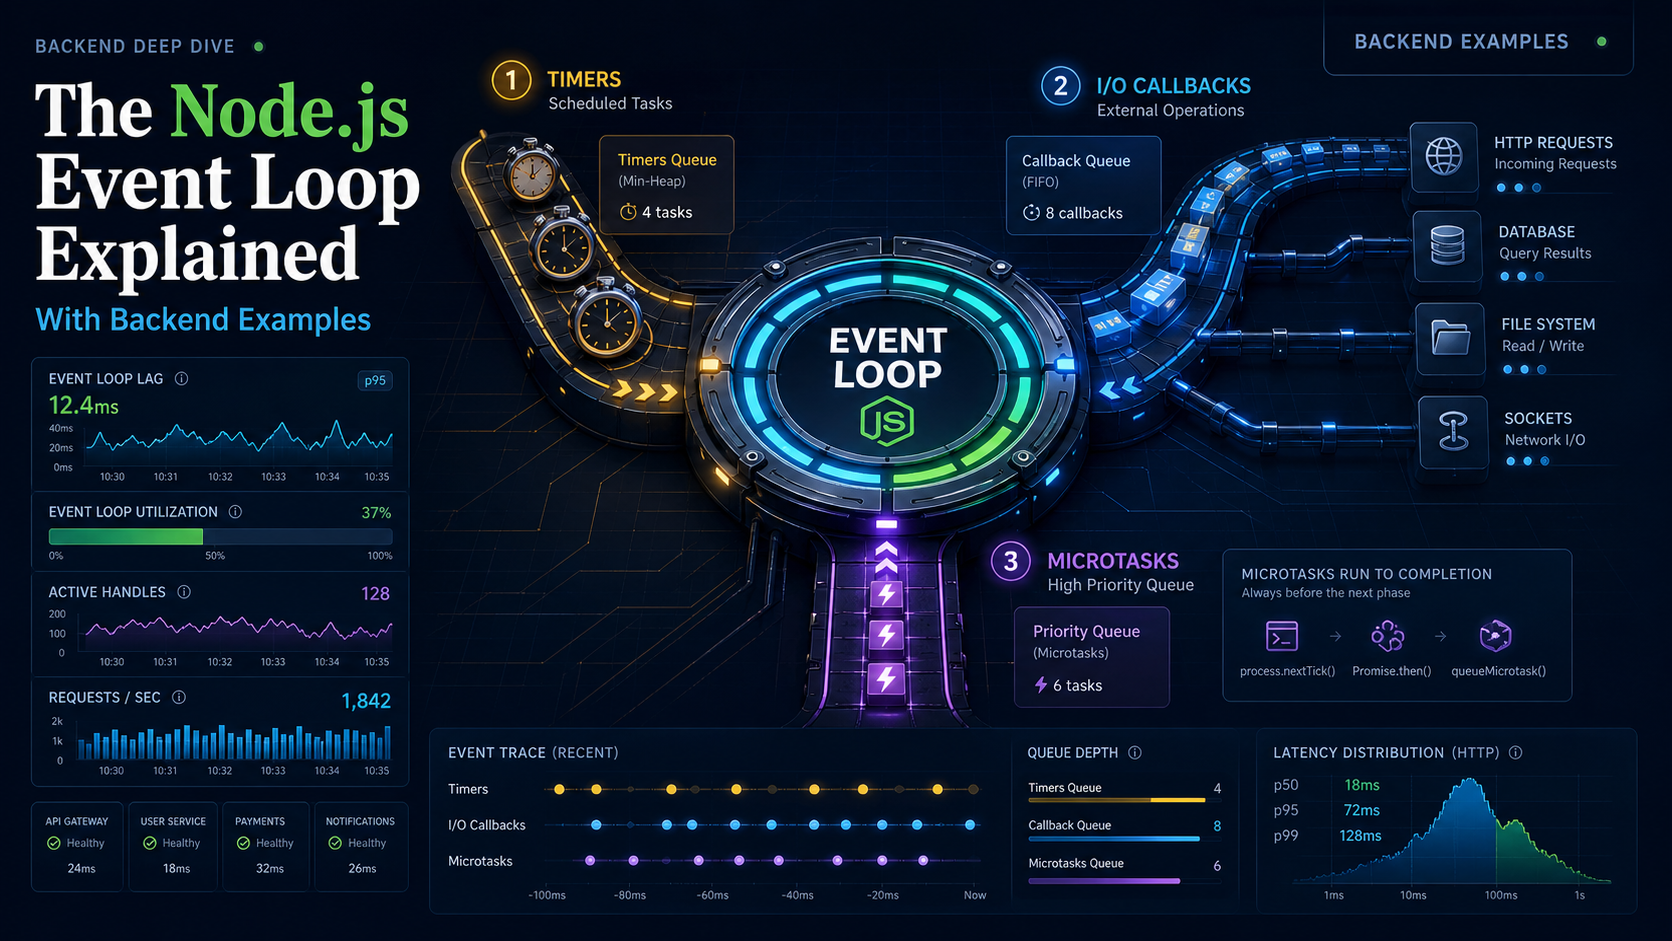
The Phases, Without The Mystery
Each turn of the loop walks through a fixed sequence. The names are mostly worth knowing for log-reading, but the order matters:
- Timers —
setTimeout/setIntervalcallbacks whose time has elapsed. - Pending callbacks — a small set of system callbacks deferred from the previous iteration.
- Poll — the loop sits here, waiting for I/O. New socket data, file reads completing, etc.
- Check —
setImmediatecallbacks. - Close —
'close'events, e.g. a socket finishing its teardown.
Between every callback in every phase, two queues drain: process.nextTick first, then Promise microtasks (.then / await continuations). That's why a nextTick storm can starve I/O — they keep the loop from ever getting back to poll.
setTimeout(() => console.log('1: timeout'), 0);
setImmediate(() => console.log('2: immediate'));
Promise.resolve().then(() => console.log('3: microtask'));
process.nextTick(() => console.log('4: nextTick'));
console.log('5: sync');
// 5, 4, 3, then 1 or 2 depending on timer resolution
Don't memorize this for trivia — remember it for debugging. When a handler "should have run by now" but didn't, the answer is almost always that something else upstream filled the microtask queue.
Microtasks Eat First
Microtasks are tempting because they feel free. They aren't. A single misbehaving promise chain can monopolize the loop for hundreds of milliseconds without ever yielding to I/O.
// Looks innocuous. Runs entirely inside one microtask drain.
async function hashAll(items: string[]) {
  const out = [];
  for (const x of items) {
    out.push(await sha256(x)); // sync work, awaited
  }
  return out;
}
If sha256 is synchronous, every await resolves immediately and the loop never breathes. The fix is either to actually do the work async (push it through crypto.subtle or a worker) or to insert real yield points — await new Promise(r => setImmediate(r)) between batches. Ugly, but it gives the poll phase a chance.

setTimeout vs setImmediate, In Backend Terms
These two are constantly confused. The practical difference:
setImmediate(cb)runscbin the next check phase, after I/O.setTimeout(cb, 0)runs in the next timer phase, on the next iteration.
If you're inside an I/O callback (like a fs.readFile completion), setImmediate will fire before setTimeout(cb, 0). Outside of I/O, the order is non-deterministic. For backend code the rule is: use setImmediate when you want to yield "after this batch of I/O finishes," and use setTimeout when you actually need a delay measured in real time.
The other one to know: queueMicrotask(cb) — it runs at the next microtask drain, before any I/O. Useful for deferring inside a tight async sequence without losing your place. Dangerous for the same reason microtasks are dangerous: it can starve the poll phase.
Measuring Loop Lag In Production
The most useful single metric for a Node service is event loop lag: the time between when a callback was scheduled and when it actually ran. If lag is consistently above ~10 ms, your service is starving itself.
You can measure it cheaply:
import { monitorEventLoopDelay } from 'node:perf_hooks';

const h = monitorEventLoopDelay({ resolution: 20 });
h.enable();

setInterval(() => {
  console.log('p99 loop delay (ms):', (h.percentile(99) / 1e6).toFixed(2));
  h.reset();
}, 5000);
monitorEventLoopDelay lives in node:perf_hooks and uses a high-resolution histogram — much more honest than a setInterval ticker because it samples on the loop itself. Wire its p99 into your metrics pipeline (Prometheus, OpenTelemetry, whatever you use) and you'll catch the next CPU-bound regression long before users complain.
Real Backend Patterns That Block The Loop
A short list of handlers I've personally watched bring services down:
- Synchronous JSON of large bodies.
JSON.parseon a 50 MB string blocks the loop for hundreds of ms. - Big regex with backtracking. A bad regex over user input is a denial-of-service vector. Test with the actual worst-case input.
bcrypt/argon2/pbkdf2on the main thread. They use the libuv pool when called async, but the sync variants block the loop completely. Use the async API and tuneUV_THREADPOOL_SIZEif you hash a lot.- Tight synchronous loops over arrays of 100k+ objects. Map/filter/reduce included. Stream them or chunk them.
fs.readFileSyncon startup is fine; in a request handler it's a disaster. Audit forSyncsuffixes in hot paths.
The unifying rule: anything that runs on the main thread for more than ~10 ms should be loud. Either move it off-thread, break it into chunks with explicit yields, or push it to a queue.
A One-Sentence Mental Model
The event loop is a single waiter taking orders from many tables — the moment one table makes them stand still, every other table is waiting too, and no amount of async keyword sprinkling will speed that waiter back up.